Dashboard#
Monitor the status of your deployments and the health of host infrastructure from the Edge Orchestrator dashboard. Following are the sections:
View Status of Deployments#
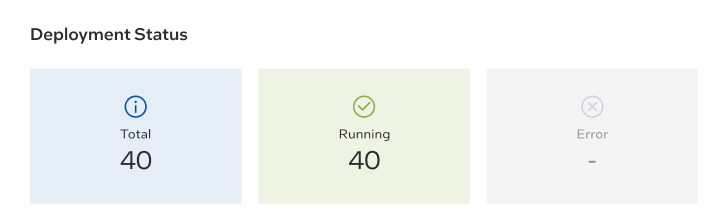
The Deployment Status section presents an at-a-glance view across all of your deployments. You can view the following statuses of the deployments:
Total: Shows the total count of deployments.
Error: Shows the total count of deployments that are not running and has encountered some error.
Running: Shows the total count of deployments that are running.
For example, in the following deployment status, there are a total of 40 deployments and the 40 deployments are running.
View Status of Host#
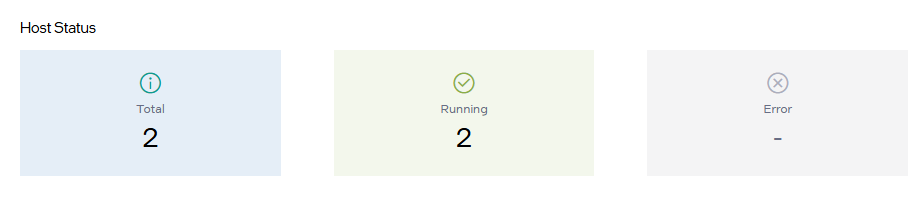
The Host Status presents an at-a-glance status of your hosts in an active state.
You can view the following statuses of the hosts:
Total: Shows the total number of hosts that are in an active state.
Running: Shows the count of active hosts that are running.
Error: Shows the count of active hosts in an error state. You can view the hosts in an error state in the dashboard by scrolling through deployments. Alternatively, go to Infrastructure > Active Hosts to find the hosts in an error state and determine how to resolve the error.
For example, in the following host status, there are a total of two running hosts.
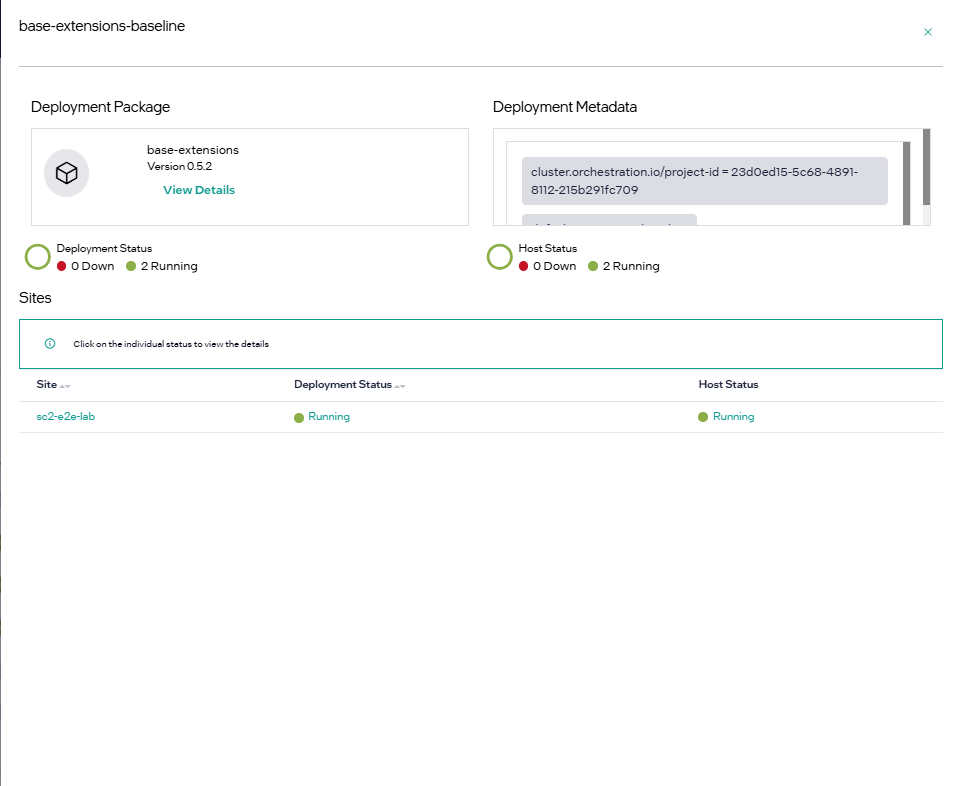
View Deployment Details#
In the Deployments Details panel the user can view deployment name and package, deployment and host status.
Click the > button on the right to view more details of the deployment, like deployment package, metadata, and sites details.
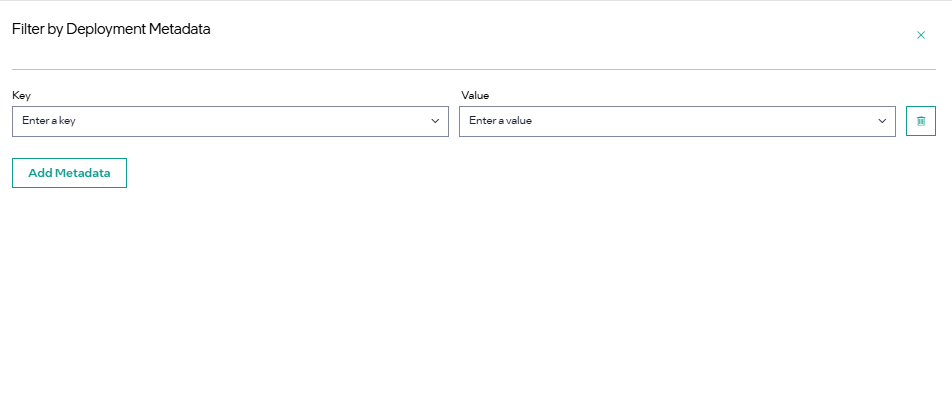
Use Metadata Filters to Customize the Dashboard#
To filter by metadata, click the Filter by Metadata button to enter your filters.
The Filter by Metadata option allows you to create a filter for the dashboard based on your unique deployment configuration metadata. For instance, you can select to filter the dashboard based on a region that you need to see. Or, if you created a “customer” category for your deployment metadata, you could also use the metadata filter to create a custom dashboard only showing deployments for that customer.
The Dashboard page displays the filtered result.
Note
The intention of metadata filters are to provide a mechanism to filter the dashboard according to a customer’s unique deployment configurations consisting of region/site data and deployment metadata assigned to the deployment and cluster.