Grafana Mimir* Software Query Issue#
Symptom#
When attempting to view dashboards in Grafana UI, all panels indicate an error.
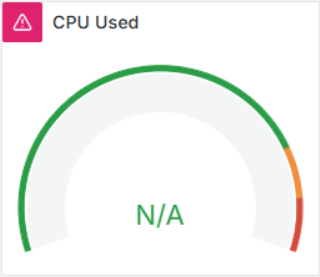
The red exclamation mark icon appearing on dashboard panel means that there is an error returned from Grafana Mimir software when querying metrics. Error messages may vary, but the most common are:
Error upstream connect error or disconnect/reset before headers. reset reason: connection failure, transport failure reason: delayed connect error: 111
Error Plugin
Cause#
This issue is most often caused by an error in the querier service in
Grafana Mimir software. The issue can occur in both stacks that use
Grafana Mimir software:
edgenode-observabilityexposed atobservability-ui.<FQDN>orchestrator-observabilityexposed atobservability-admin.<FQDN>
The underlying root cause is unknown, but the issue can be identified when:
the connection between
query-frontendandquerieris brokenthe setup is unable to heal by itself (reconnect)
Sample extract from query-frontend logs that indicates broken connection:
ts=2025-03-01T03:53:52.014590133Z caller=mimir.go:868 level=info msg="Application started"
ts=2025-03-01T07:52:37.568742517Z caller=spanlogger.go:109 level=error msg="error processing request" try=0 err="rpc error: code = Canceled desc = context canceled"
...
ts=2025-03-01T07:52:57.48044312Z caller=frontend.go:358 level=info msg="not ready: number of queriers connected to query-frontend is 0"
Solution#
The issue cannot be fixed automatically and requires manual intervention. The following steps can be taken to resolve the issue:
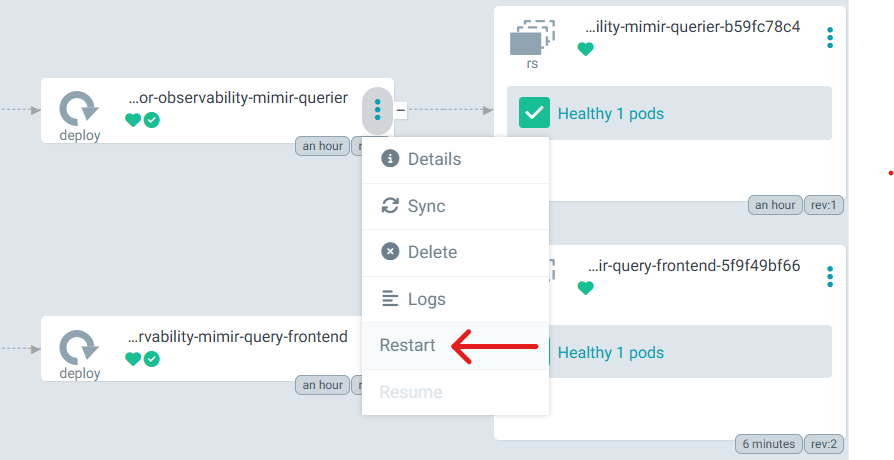
log into
ArgoCDand navigate to theedgenode-observabilityororchestrator-observabilityapplication (depending on where the issue is observed)locate
query-frontendDeployment (ReplicaSet) and restart itif the issue persists, restart the
querierDeployment (ReplicaSet) as well