Edge Orchestrator Edge Orchestrator Cluster Dashboard#
Using the Edge Orchestrator Cluster Dashboard, you can view the general performance, system information, and track the connectivity and maintenance status of the Edge Orchestrator.
Access Edge Orchestrator Cluster Dashboard#
To view the Edge Orchestrator Cluster dashboard, perform these steps:
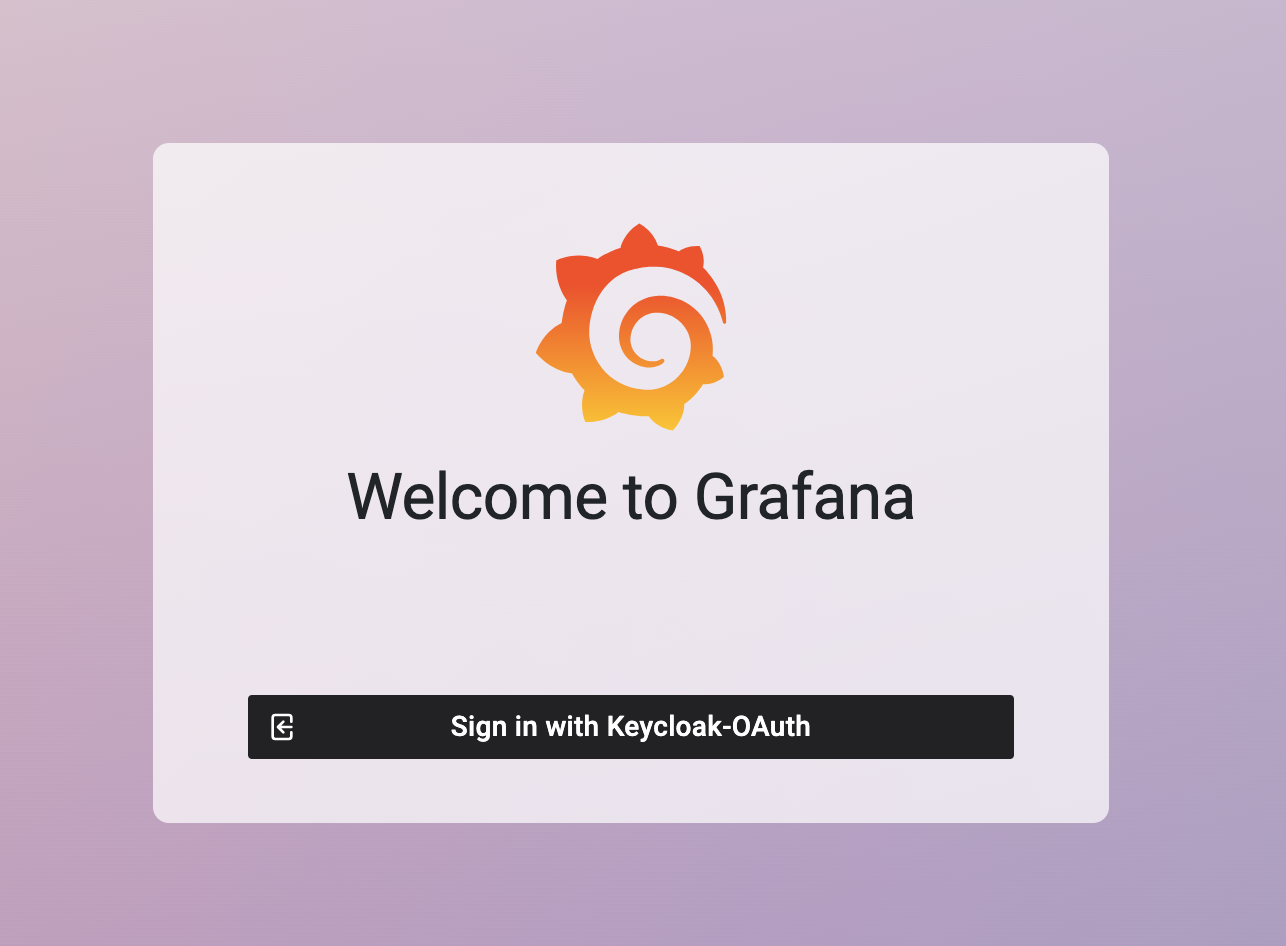
In the browser, navigate to https://observability-admin.<domain>
Click Sign in with Keycloak-OAuth from the Grafana* dashboard interface. The Edge Orchestrator Cluster Dashboard appears.
Note
The access to the dashboard the user must belong to Service-Admin-Group, which grants these roles:
telemetry-client/viewer role allows for viewing the dashboard
telemetry-client/admin role allows for editing the dashboard
For additional details, see Edge Orchestrator Groups and Roles.
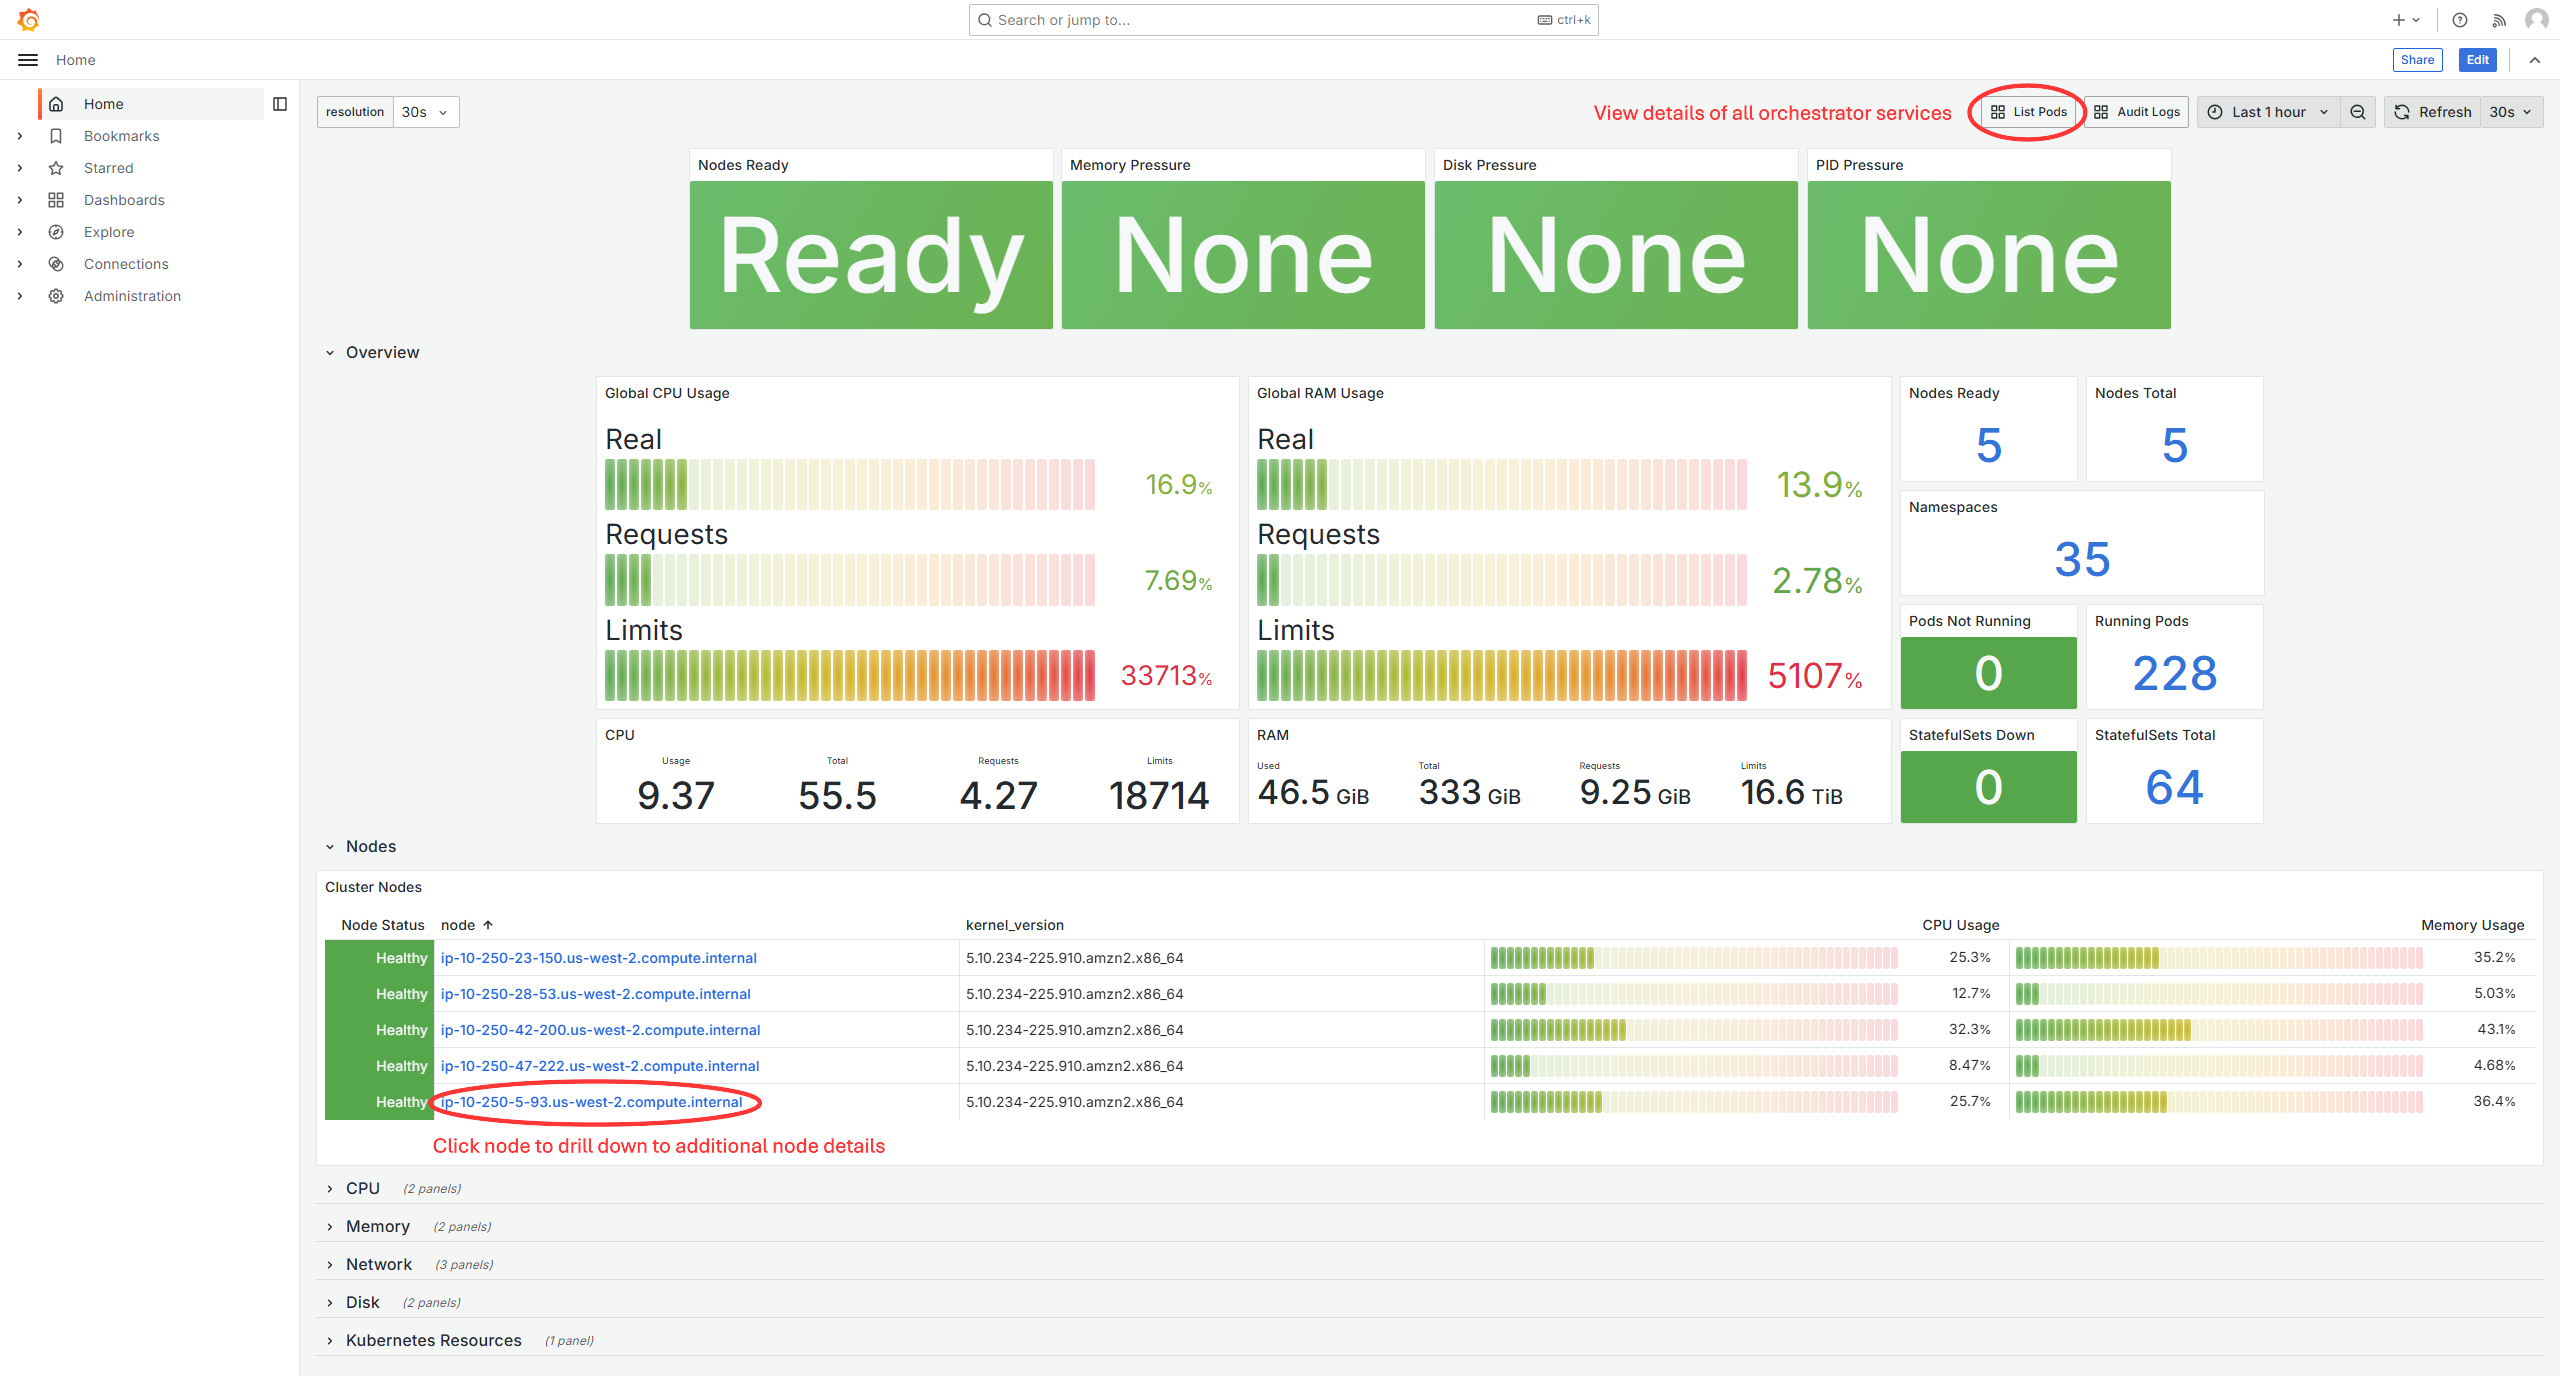
General Performance and System Information#
The Home dashboard shows the metrics for general performance and system information of the Edge Orchestrator.
Auditing via Logs#
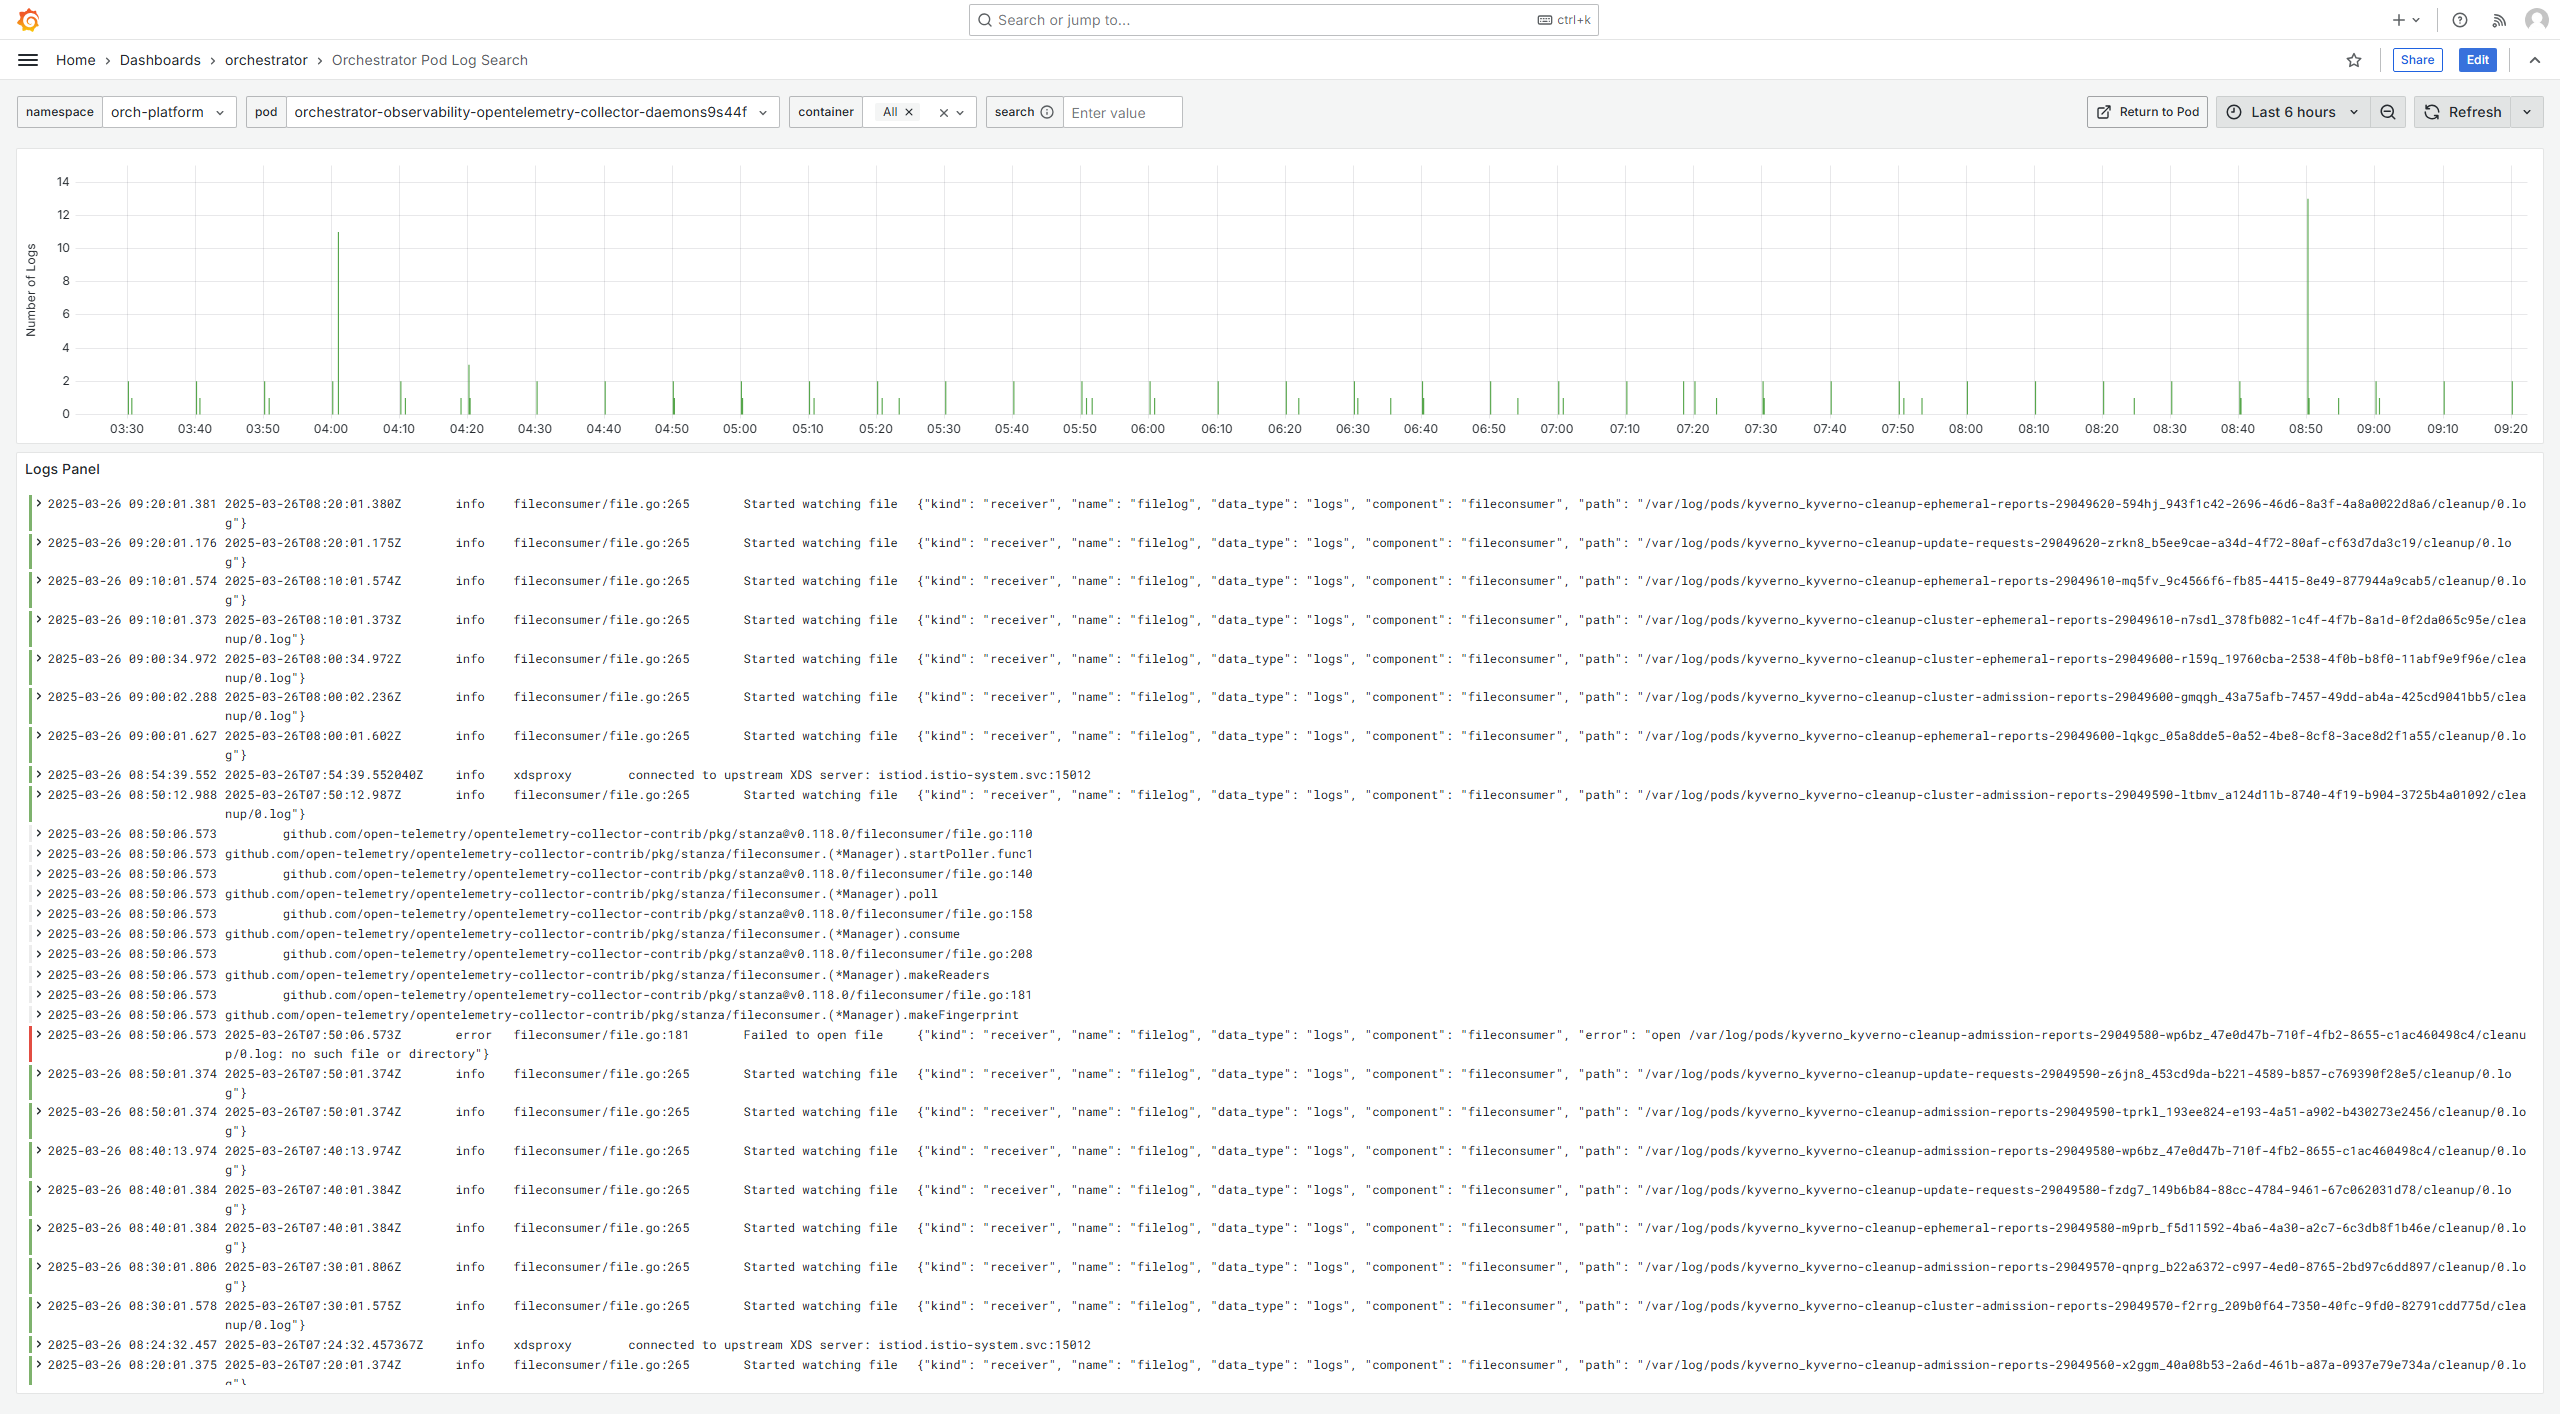
To audit on operations performed through REST Northbound APIs, Edge Orchestrator provide logs that include the path, operation request, response, errors, status, the user, and the email of the requester.
To visualize audit logs, from the Orchestrator section navigate to the Audit Logs dashboard:
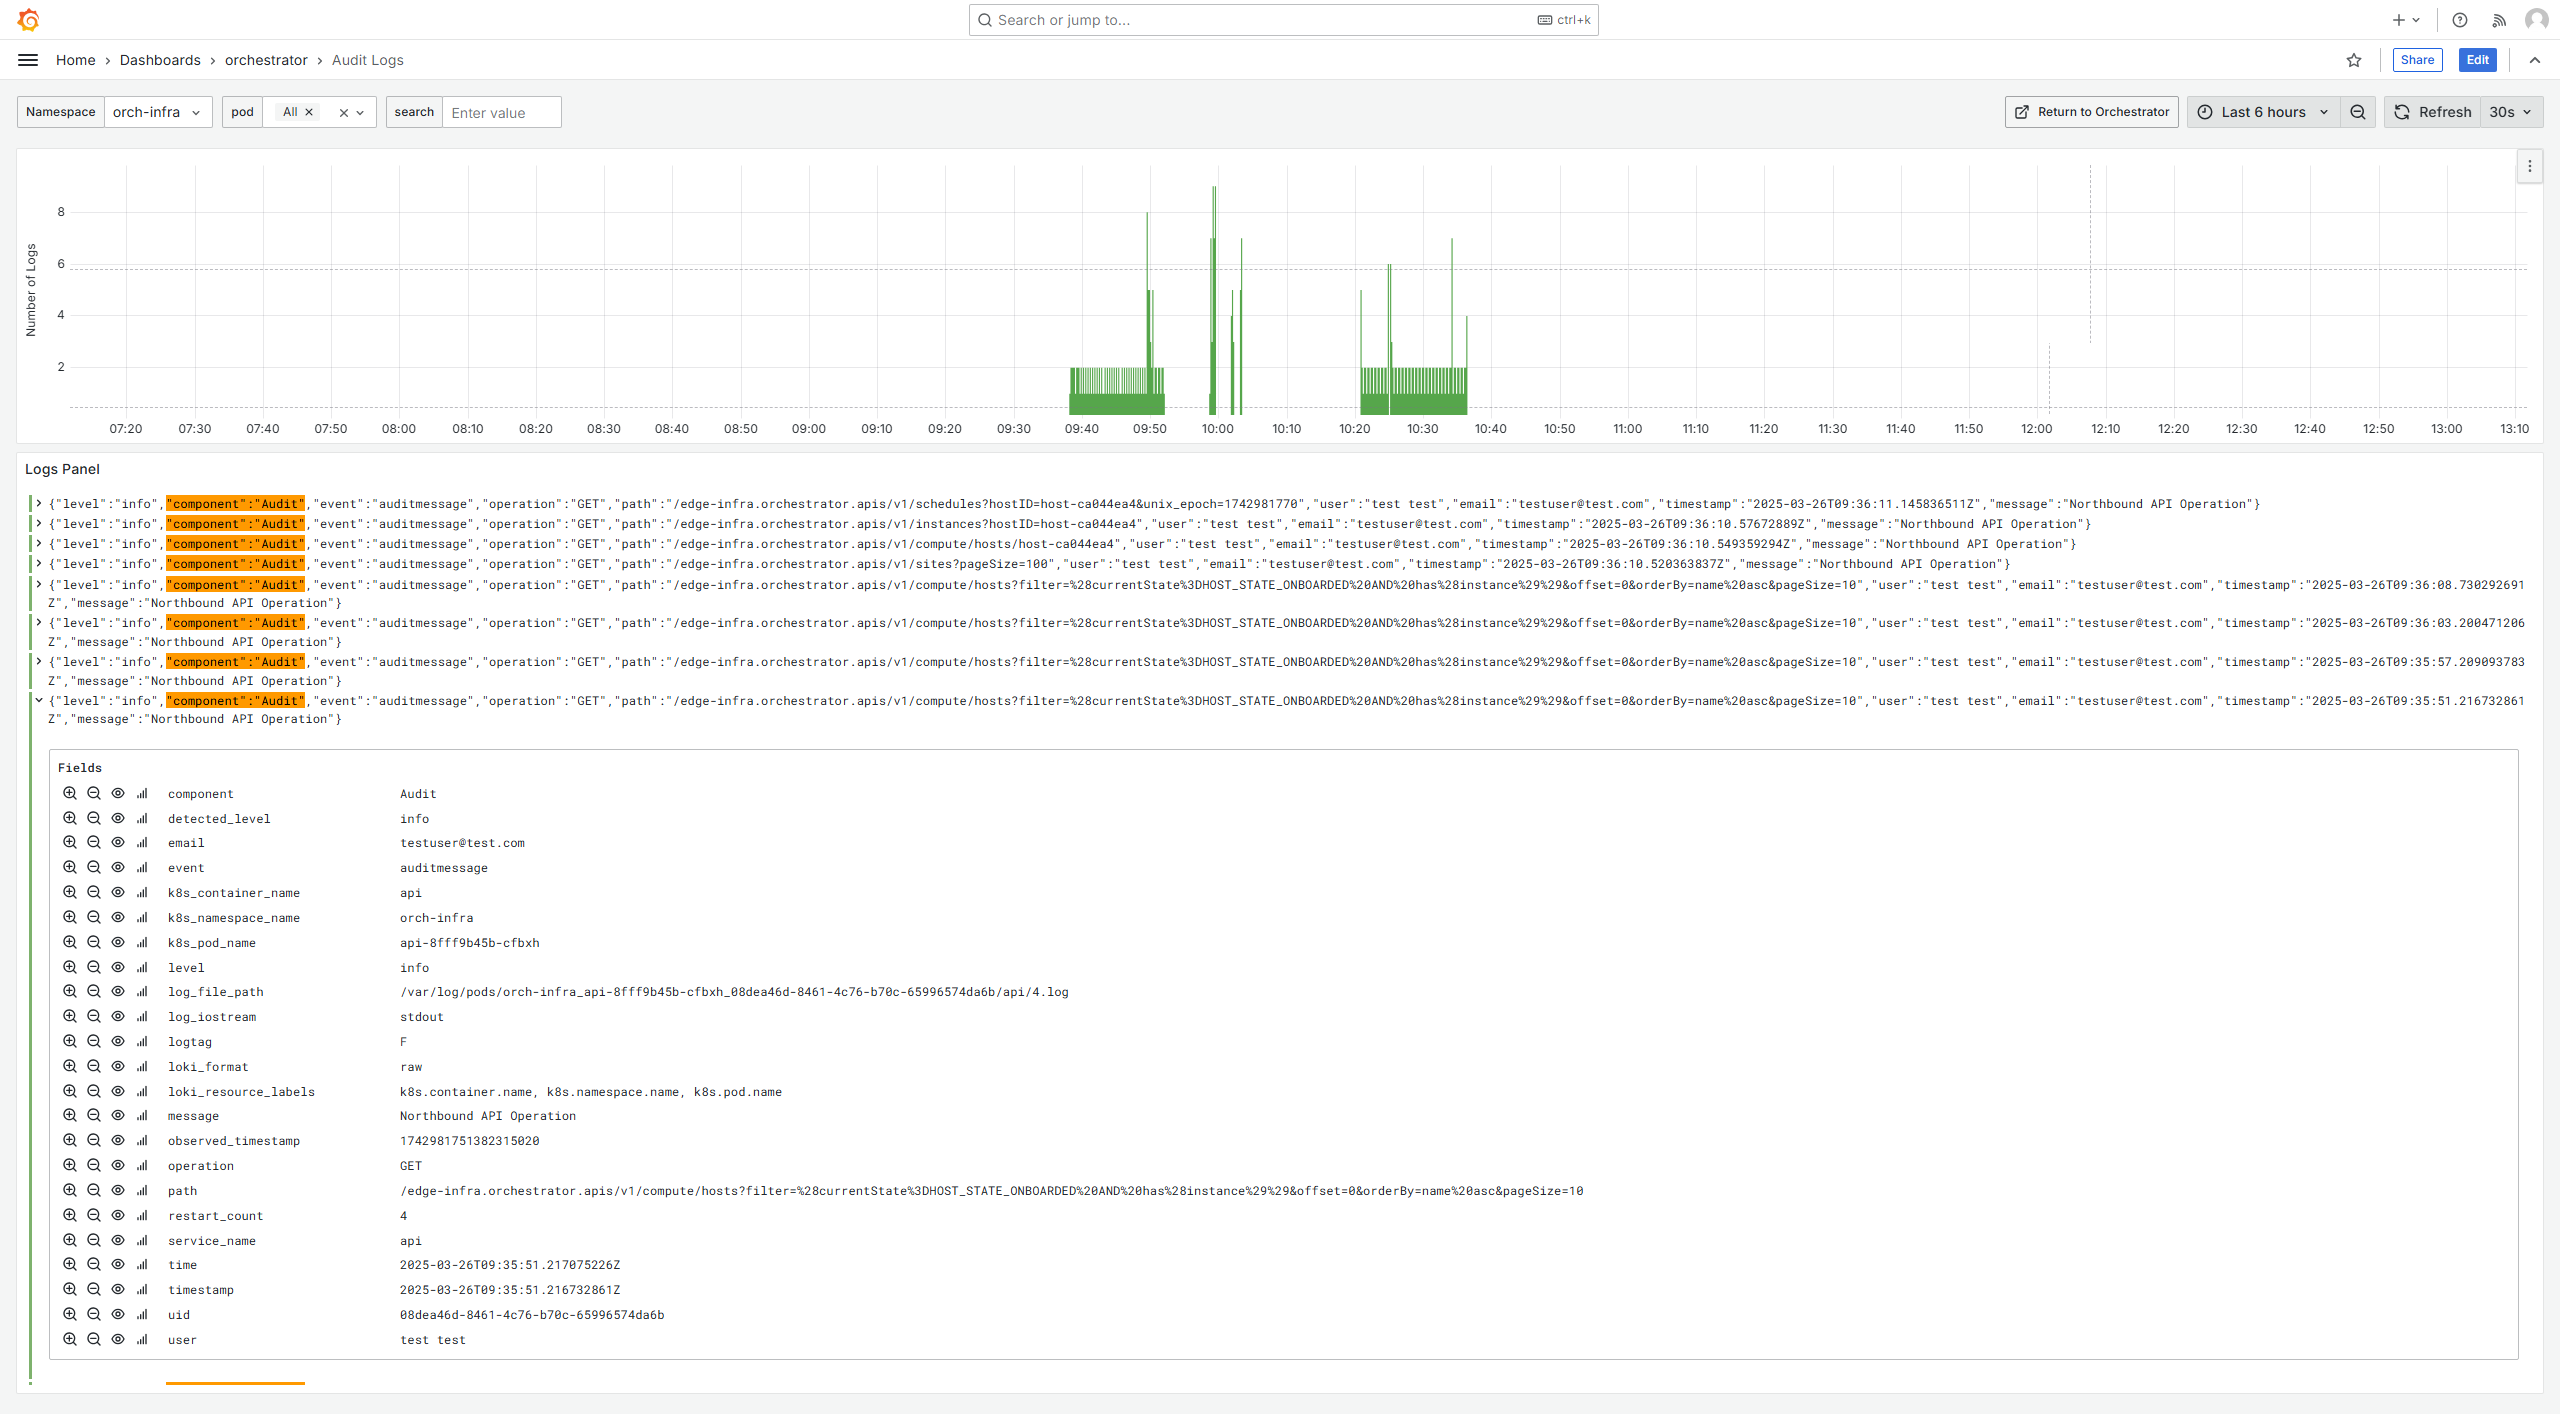
A key/value pair .Str(“event”, “auditmessage”) is appended to each log message for ease of this Grafana dashboard filtering. You can perform additional filtering by using off-the-shelf Grafana tools.
The following is an example of the Audit Log for REST APIs calls:
{
  "level": "info",
  "component": "Audit",
  "event": "auditmessage",
  "operation": "POST",
  "path": "test",
  "user": "username",
  "email": "test_email",
  "timestamp": "2024-06-19T15:01:00.395963Z",
  "message": "Northbound API Operation"
}
Node Details#
When drilling down to a node, you can view details about all of the pods deployed to the node, as well as overall resource usage of the node:
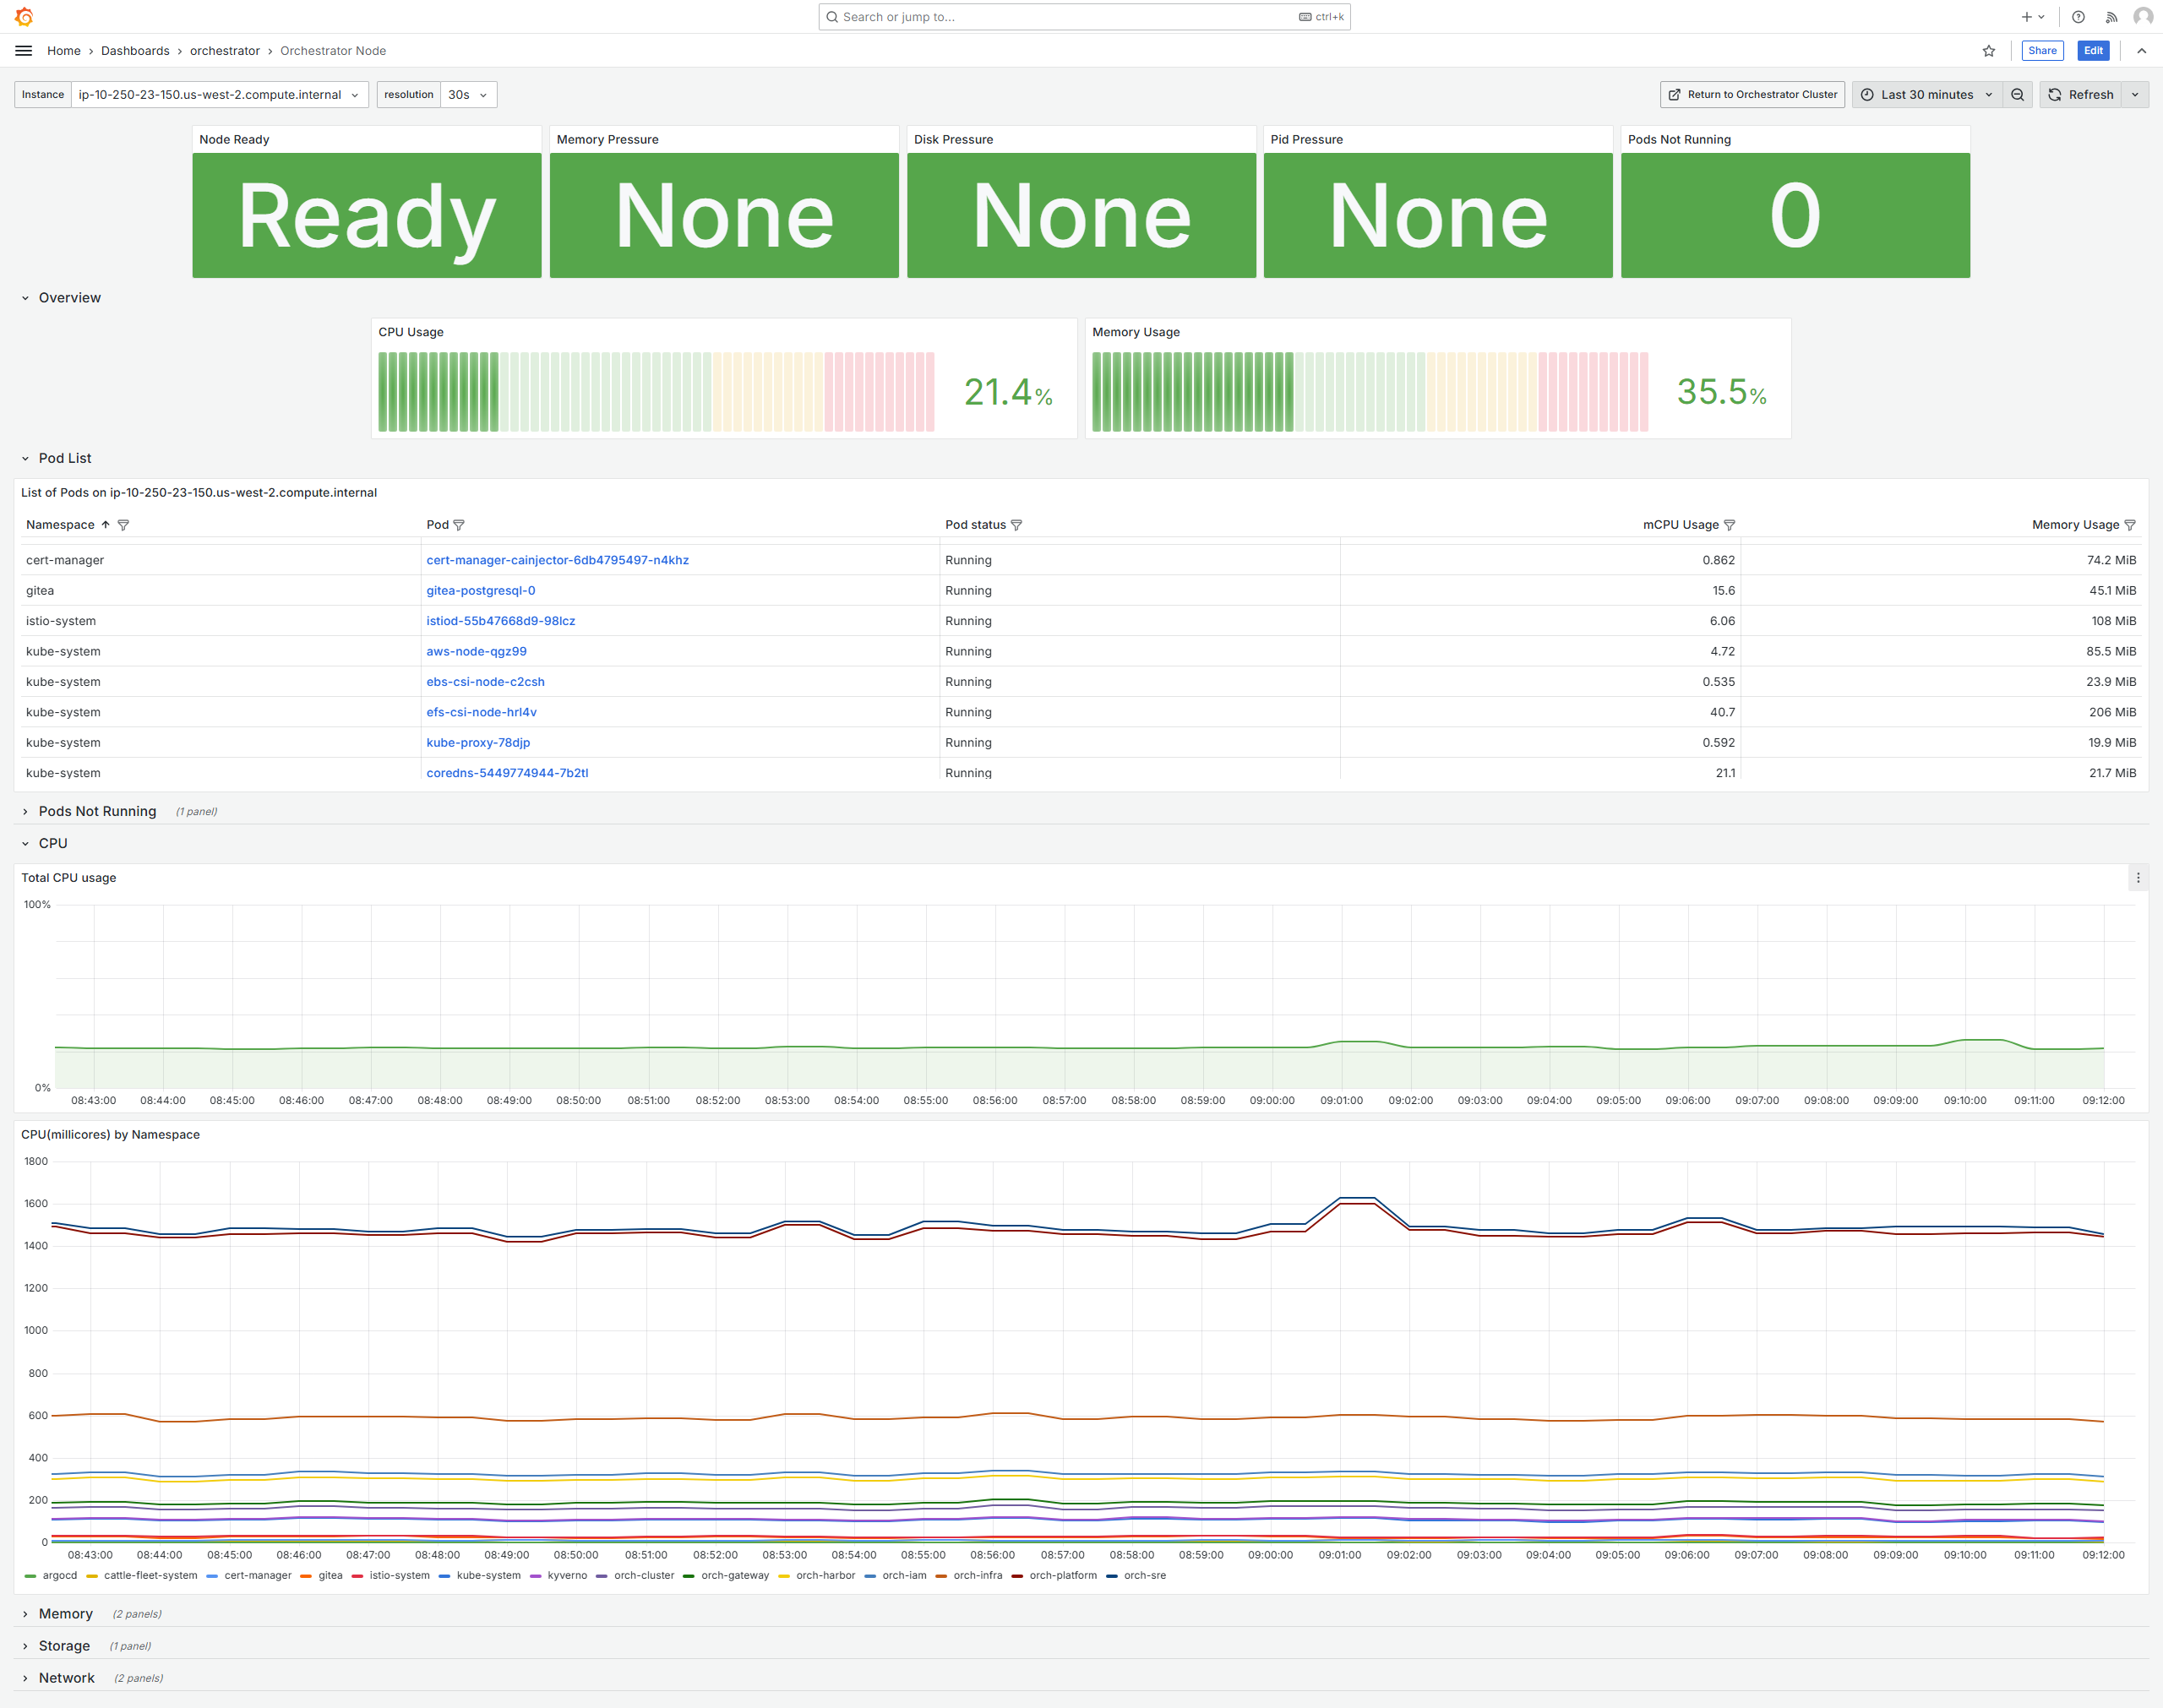
You can click on a pod name to see details regarding the pod:
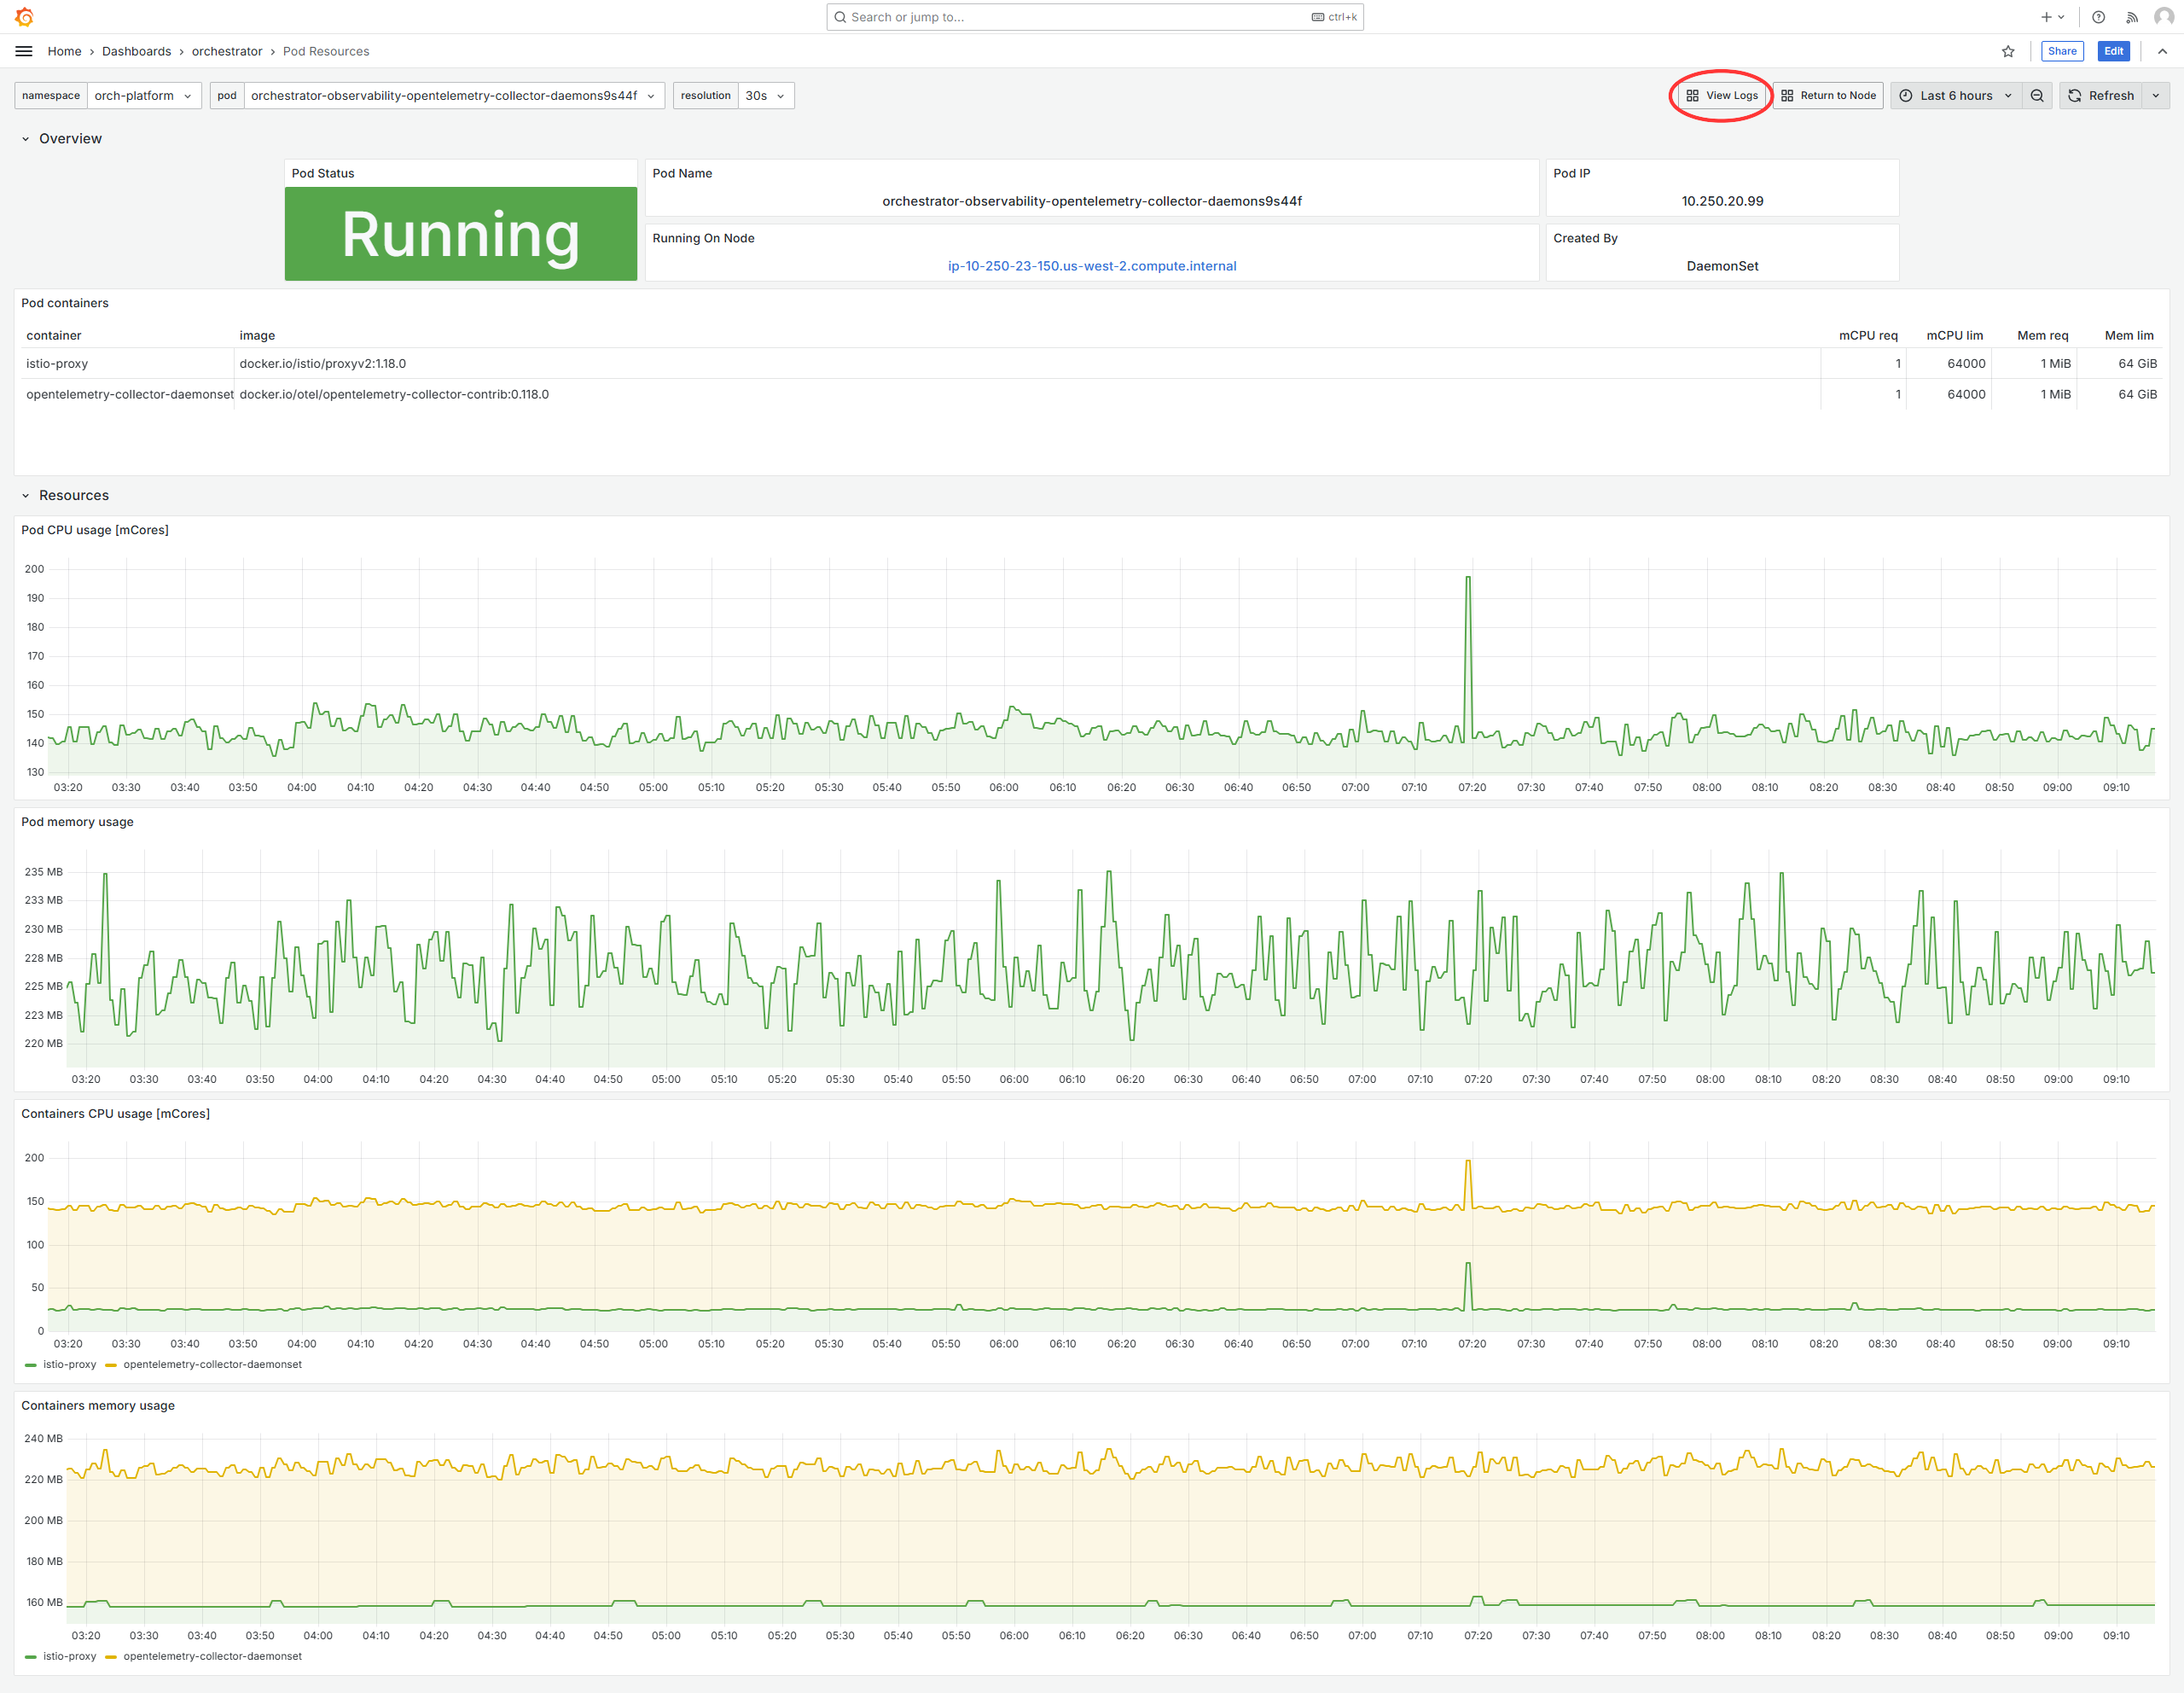
From the Pod details dashboard, click Logs in the top right corner to see the pod’s logs: