Customize the Application#
This comprehensive guide provides a detailed walkthrough of building a complete object tracking
and loitering detection system. It utilizes a combination of technologies designed for ease of
use: Deep Learning Streamer Pipeline Server (DL Streamer Pipeline Server) with native
gvaanalytics zone and dwell-time analytics, and the data visualization Grafana platform. This
approach caters to no-code/low-code users, enabling the creation of sophisticated analytics
solutions with minimal programming.
Overall System Architecture#
The system follows a modular architecture:
Video Input: Cameras or video streams provide the raw data.
Deep Learning Streamer Pipeline Server (DL Streamer Pipeline Server): Processes video streams locally using AI models to detect and track objects across the full frame, and evaluates each tracked object against configurable zone polygons to compute dwell time natively via the
gvaanalyticselement — no external data-processing service required.Grafana: Visualizes the published MQTT data (zone presence, dwell time, and loitering status), providing real-time dashboards.
DL Streamer Pipeline Server#
For detailed documentation on Deep Learning Streamer Pipeline Server (DL Streamer Pipeline Server), visit the DL Streamer Pipeline Server Documentation.
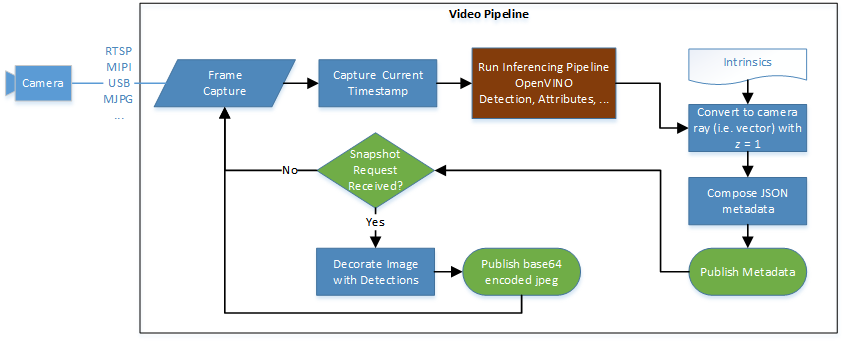
The DL Streamer Pipeline Server is a powerful tool designed to process video feeds directly on edge devices. It leverages GStreamer pipelines and OpenVINO™ optimized AI models to perform real-time object detection and tracking, minimizing latency and reducing bandwidth consumption.
Key DL Streamer Pipeline Server Components#
Logging and general configuration#
C_LOG_LEVEL: INFO- Sets the logging level for C components to “INFO,” which provides useful information about the system’s operations without being overly verbose.PY_LOG_LEVEL: INFO- Similarly, sets the logging level for Python components.
Video processing pipelines#
The DL Streamer Pipeline Server utilizes GStreamer pipelines to define the flow of video data through various processing elements. This app defines a single family of pipelines that run detection, tracking, and zone/dwell-time analytics together (see below) — there is no separate detection-only pipeline stage.
Object tracking pipelines#
Pipelines object_tracking_cpu, object_tracking_gpu, and object_tracking_npu each run
detection, tracking, and zone/dwell-time analytics in a single pipeline for a given device; a
stream is launched against one of these by REST call (see sample_start.sh), which assigns it
a per-instance MQTT topic and WebRTC peer-id (e.g. object_tracking_1).
Pipelines:
object_tracking_cpu,object_tracking_gpu,object_tracking_npuHow They Work:
Detection Model: Uses the
pedestrian-and-vehicle-detector-adas-0001model for specialized tracking.gvadetectruns withinference-region=0, so detection/tracking analyze the full frame, not just the configured zone polygons.Tracking Element: Incorporates
gvatrackwith the settingtracking-type=zero-termto follow objects over time.Zone & Dwell-Time Analytics: The
gvaanalyticselement evaluates each tracked object’s position against a per-stream polygon zone config file and computes dwell time; it is the only stage whose output is restricted to the configured zones — an object outside every zone is still detected and tracked, just not reported as present/dwelling in a zone.loitering_watermark(a reused DL Streamer sample element) renders the dwell-time/status text overlay on the video.Additional Parameters:
Threshold: Set to0.1to balance sensitivity and accuracy.Inference Interval: Controls how often the model analyzes frames.
Benefits: These pipelines help track moving objects (like people or vehicles) across frames, which is essential for loitering detection and other advanced analytics.
Configurable parameters#
Each pipeline is designed to be user-friendly and customizable:
Detection Properties: Configurable parameters let you adjust the model settings without writing code. Example: The “detection-properties” element defines how the object detection module should behave.
Detection Device: The “detection-device” parameter determines which hardware (e.g., CPU) to use. It uses an environment variable (
{env[DETECTION_DEVICE]}) to make it flexible across different setups.
Messaging Interface (MQTT)#
To share the results of the video analysis with other parts of your system, the DL Streamer Pipeline Server uses a messaging interface based on Message Queuing Telemetry Transport (MQTT):
Publisher Configuration:
Name: defaultType: mqttEndpoint: tcp://0.0.0.0:1883Topics:Each launched stream publishes its raw per-frame metadata underobject_tracking/<N>(set per-instance viadestination.metadata.topicin the REST launch payload, not hardcoded; seesample_start.sh). Themqtt-table-flattenersidecar republishes a reshaped summary toloiter_status/<N>for the Grafana table.Allowed Clients: *(*denotes ‘all’, ensuring that any subscribed system can receive the data)
DL Streamer Pipeline Server workflow#
Capture and Decode: Live video is captured and decoded using GStreamer.
Detection and Tracking: The object detection pipelines analyze each frame to identify objects. The tracking pipelines then follow these objects over time, ensuring that moving objects are continuously monitored.
Data Enrichment and Publishing: Detected objects are enriched with metadata (such as bounding boxes, timestamps, and object types). The processed data is published via MQTT, making it available for dashboards.
Zone & Dwell-Time Analytics (gvaanalytics)#
For detailed documentation on the
gvaanalyticselement, visit the DL Streamer documentation.
Zone presence and dwell-time computation run natively inside the DL Streamer pipeline via the
gvaanalytics element — no external low-code tool or custom service is required. This keeps
the whole pipeline (detection, tracking, zone/dwell analytics, and the on-screen watermark) in
one process, and the resulting data already flows to MQTT through the pipeline’s existing
gvametaconvert + destination.metadata publish path.
gvadetect (inference-region=0) and gvatrack always run on the full video frame — there is
no ROI-cropping element in this pipeline, so every object in frame is detected and tracked
regardless of the zone polygons. gvaanalytics is the stage that narrows scope: it only reports
zone presence and dwell time for the polygon region(s) defined in the stream’s zone-config file;
objects outside those polygons are detected/tracked but produce no zone/dwell metadata.
Zone configuration files#
Each stream has its own zone-config JSON file under src/dlstreamer-pipeline-server/zones/
(mirrored under helm-chart/config/dlstreamer-pipeline-server/zones/ for Helm deployments),
for example VIRAT_S_000101.json:
{
    "zones": [
        {
            "id": "region1",
            "type": "polygon",
            "points": [
                {"x": 208, "y": 390},
                {"x": 2, "y": 489},
                {"x": 2, "y": 296},
                {"x": 197, "y": 237}
            ],
            "track-dwell-time": true,
            "object-retention": 1.0,
            "color": {"r": 0, "g": 255, "b": 0},
            "thickness": 2
        }
    ]
}
id: Zone identifier, reported aszone_idin the published metadata.type:"polygon"(arbitrary number of points) or"circle".track-dwell-time: Enables dwell-time computation for this zone.object-retention: Grace period (seconds) to keep zone state after an object leaves.color/thickness: Used when rendering the zone outline on the video overlay.
A zone file can contain any number of zones — adding a second or third zone to a stream is
purely a matter of adding another entry to the zones array in that stream’s JSON file.
Adding or editing a zone (no code changes)#
Edit (or add zones to) the stream’s JSON file under
src/dlstreamer-pipeline-server/zones/.Restart that stream’s pipeline instance so it picks up the change (
gvaanalyticsonly reads its config file once, when the pipeline starts — editing the file does not hot-reload a running pipeline):./sample_stop.sh ./sample_start.sh
No config.json, pipeline string, or Grafana dashboard changes are needed.
Adding a new stream#
Add a video file under
src/dlstreamer-pipeline-server/videos/and a matching zone-config JSON file undersrc/dlstreamer-pipeline-server/zones/.Launch it with one more REST call (see
sample_start.shfor the pattern), passing"analytics-properties": {"config": "/home/pipeline-server/zones/<your-zone-file>.json"}in theparametersobject, alongside a uniquedestination.metadata.topic/destination.frame.peer-idfor the new stream.Add the new stream name to the
streamdashboard variable in the Grafana dashboard so its video panel is rendered (the MQTT status table requires no change — it already subscribes to a wildcard topic covering all streams).
Published metadata#
gvametaconvert (already part of the pipeline) natively serializes each tracked object’s zone
membership and dwell time into the existing MQTT payload on object_tracking/<N>, per object:
{
  "objects": [
    {
      "id": 7,
      "x": 120, "y": 240, "w": 40, "h": 90,
      "roi_type": "pedestrian",
      "zone_violations": ["region1"],
      "dwell_times": [
        {"zone_id": "region1", "dwell_time_sec": 6.2, "first_seen_timestamp_sec": 118.4}
      ]
    }
  ],
  "resolution": {"width": 1280, "height": 720},
  "timestamp": 123456789
}
No custom metadata-publishing code is needed — this is the same MQTT topic and publish
mechanism the application already uses for object detection/tracking data. object_tracking/<N>
is never modified by this application and remains available as-is for any external integration
that wants the raw, full per-frame payload.
Grafana table data (mqtt-table-flattener)#
Grafana’s MQTT data source maps one MQTT message to one table row, and cannot expand a nested
JSON array (like objects above) into multiple rows on its own. A small sidecar service,
mqtt-table-flattener (src/mqtt-table-flattener/flatten.py), bridges this gap:
Subscribes read-only to
object_tracking/+(never alters it).Performs no zone/dwell-time computation itself — all of that is still done exclusively by
gvaanalytics; the flattener only reshapes already-computed values for display.Once a second, republishes one small flat message per currently-dwelling object to
loiter_status/<N>, e.g.{"Stream": "1", "Track ID": 7, "Type": "pedestrian", "Zone": "region1", "Dwell Time (s)": 6.2}.Stops republishing a stream once it has been silent for a few seconds (
STALE_AFTER_SEC, default 3s), so the table correctly empties out after a pipeline stops instead of repeating its last-known state forever.Runs as a second container from the same
dlstreamer-pipeline-serverimage (already pulled for the main pipeline service, and already haspaho-mqtt) — no extra image pull and nopip installat runtime, so it works in air-gapped deployments too.The
object_tracking/loiter_statustopic prefixes are not hardcoded: they come fromSOURCE_TOPIC_PREFIX/DEST_TOPIC_PREFIXin the root.env(Compose) ormqtt_table_flattener.sourceTopicPrefix/destTopicPrefixinhelm-chart/values.yaml(Helm).
The Grafana dashboard’s status table subscribes to loiter_status/+ and needs no per-stream
changes when adding a new stream, since it already covers the whole topic namespace.
Video overlay#
The reused loitering_watermark element reads the same dwell-time metadata and draws a
per-object dashboard line (<zone_id>: <type>-<id> : <dwell_time>s), turning red once dwell
time crosses the configured loitering-threshold (default 5.0 seconds). See
Get Started for how to tune or disable this overlay via REST parameters at
launch time.
Grafana visualization#
Note
For detailed Grafana documentation, visit the Official Grafana Documentation.
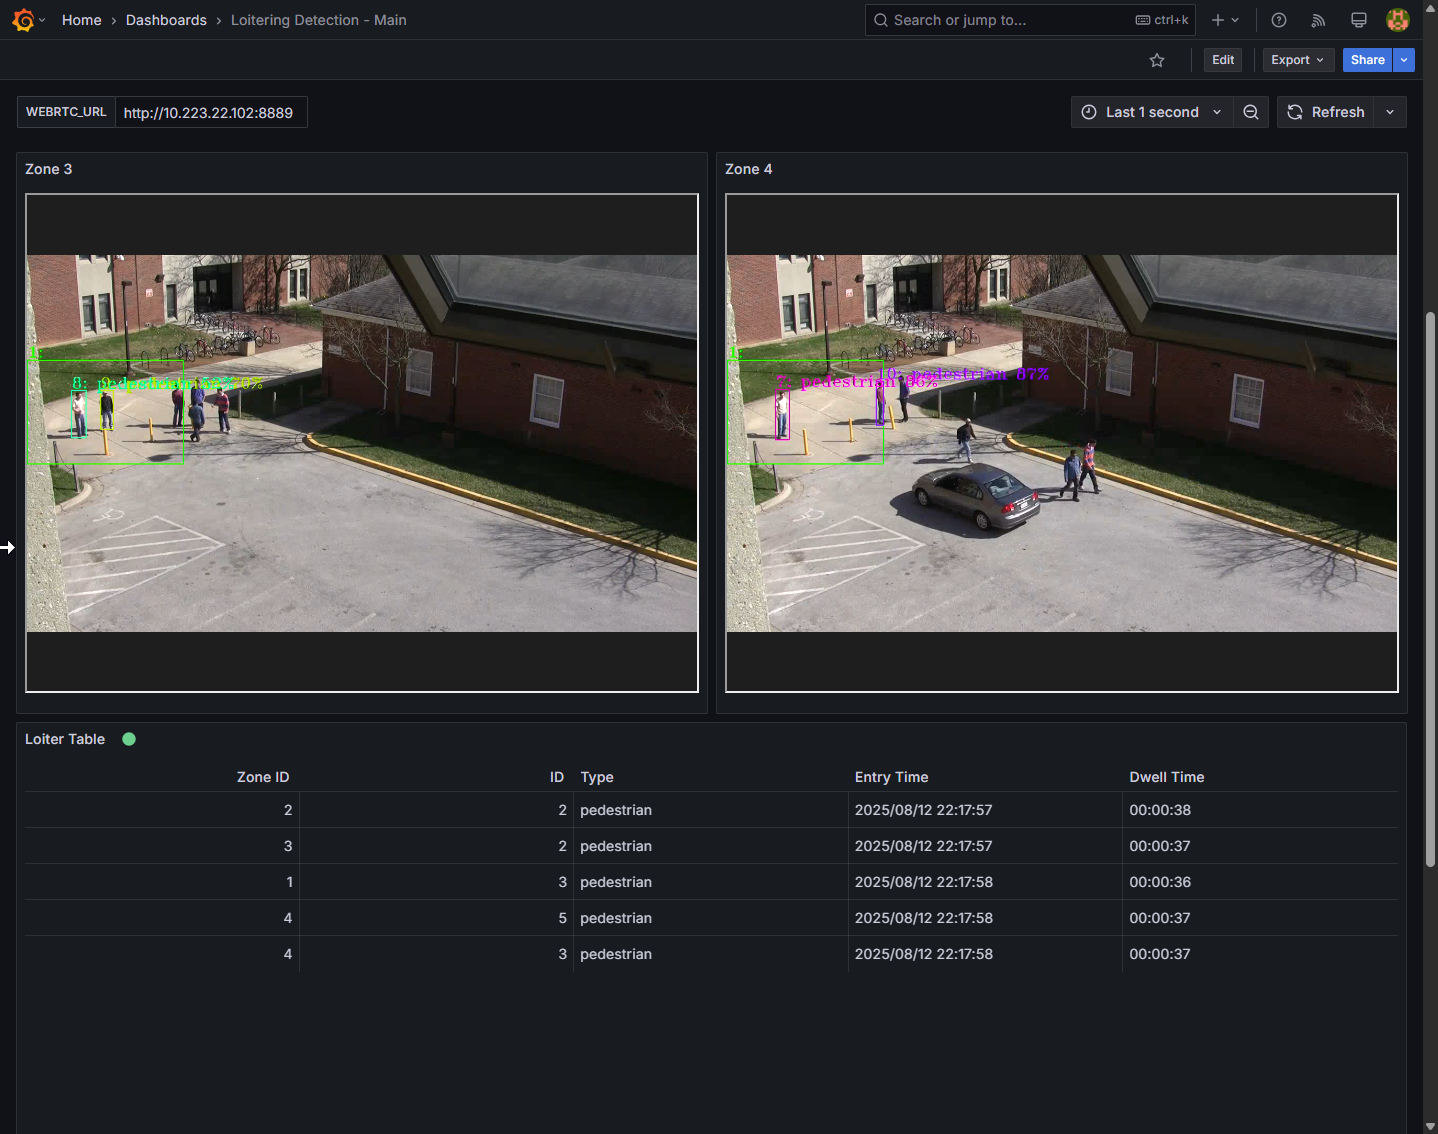
Grafana is a powerful, open-source visualization tool that helps you create dynamic dashboards for monitoring real-time data. With Grafana, you can easily visualize the outputs from your DL Streamer Pipeline Server without deep coding skills. Here is how you can leverage Grafana in your analytics workflow.
Key Grafana Components#
Data Sources#
MQTT Integration: Directly query data from the DL Streamer Pipeline Server via MQTT datasource.
Dashboards and Panels#
Dashboards: A collection of panels arranged to provide an overview of your system’s performance.
Panels: Individual visualizations (graphs, tables, single-stat panels) that display specific data points.
Setting up Grafana#
Install and launch Grafana#
Installation: Install Grafana on your local machine or server by following the official Grafana installation guide.
Access: Once installed, access Grafana via your web browser at the designated URL.
Add Your data source#
Step-by-Step (Example with MQTT):
Go to
Configuration > Data Sources.Click
Add data sourceand selectMQTT.Enter the connection details (host, port, topic, credentials).
Save and test the connection to ensure it works.
Create your dashboard#
Dashboard Creation:
Click the
+icon and selectDashboard.Add panels by clicking
Add new panel.Configure each panel with queries to fetch data from your connected MQTT data source.
Use drag-and-drop controls to arrange panels for the best view of your metrics.
Grafana use cases for object tracking and Loitering Detection#
Real-Time Object Detection Visualization: Display a graph that shows the number of objects detected per minute to monitor activity levels.
Loitering Event Monitoring: Create a panel that highlights loitering events.
Historical Trend Analysis: Use Grafana’s time-series graphs to analyze trends over days or weeks, helping you identify peak activity times or recurring patterns.
End-to-End integration#
The system operates as follows:
Video Input: A camera captures video and sends the stream to the DL Streamer Pipeline Server.
DL Streamer Pipeline Server Processing: The DL Streamer Pipeline Server processes the video, detects and tracks objects using its AI models, and evaluates each tracked object against configured zone polygons via
gvaanalyticsto compute zone presence and dwell time. It publishes metadata about the detected objects (ID, bounding box coordinates, object type, timestamps, zone presence, and dwell time) to MQTT.MQTT Bridging (DL Streamer Pipeline Server Configuration): The DL Streamer Pipeline Server is configured to relay the MQTT messages to an MQTT broker. This broker acts as a central hub for the data.
Grafana Visualization: Grafana directly consumes MQTT topics through its MQTT datasource to create dashboards showing real-time object counts and loitering events.
Data at each step:
DL Streamer Pipeline Server Output (MQTT): JSON payload containing an array of detected objects. Each object has properties like
id,roi_type,confidence, bounding box coordinates,zone_violations, anddwell_times(zone ID, dwell time, and first-seen timestamp).
Conclusion#
This section has demonstrated a complete object tracking and loitering detection system using
DL Streamer Pipeline Server (with native gvaanalytics zone/dwell-time analytics) and Grafana.
The system provides a balance of edge processing and powerful visualization, with zone
configuration handled entirely through JSON files — no custom data-processing service, flow
duplication, or per-zone code is required. This allows for quick deployment, easy customization
for specific use cases, and scalability to handle multiple cameras and zones.