Performance Testing#
This article covers performance testing in ViPPET. Users can test single pipelines as well as multiple pipelines running concurrently. Both testing modes provide the same metrics and optional output videos, allowing users to evaluate system performance under different workload conditions.
Test a single pipeline#
First, navigate to the Performance page. Then, select the pipeline you want to test and specify the number of streams to process.
Configuration options#
Before running the test, configure the following settings:
Setting |
Description |
|---|---|
Pipeline |
Select a pipeline variant to test |
Streams |
Number of parallel streams (copies of the pipeline) to run simultaneously |
Output mode |
|
Max runtime |
Maximum execution time in seconds (0 = run until end of video source) |
Metadata mode |
|
Enable latency metrics |
When enabled, measures end-to-end pipeline latency (avg/min/max) per reporting interval. See Latency metrics for details. |
Once all settings are configured, click Run performance test.
Monitoring metrics during execution#
While the test runs, the dashboard displays real-time metrics:
System metrics — CPU, GPU, NPU utilization, memory usage, and power consumption
Pipeline metrics — Total FPS and Per Stream FPS
Latency metrics — Average, minimum, and maximum buffer latency per reporting interval (when latency metrics are enabled)
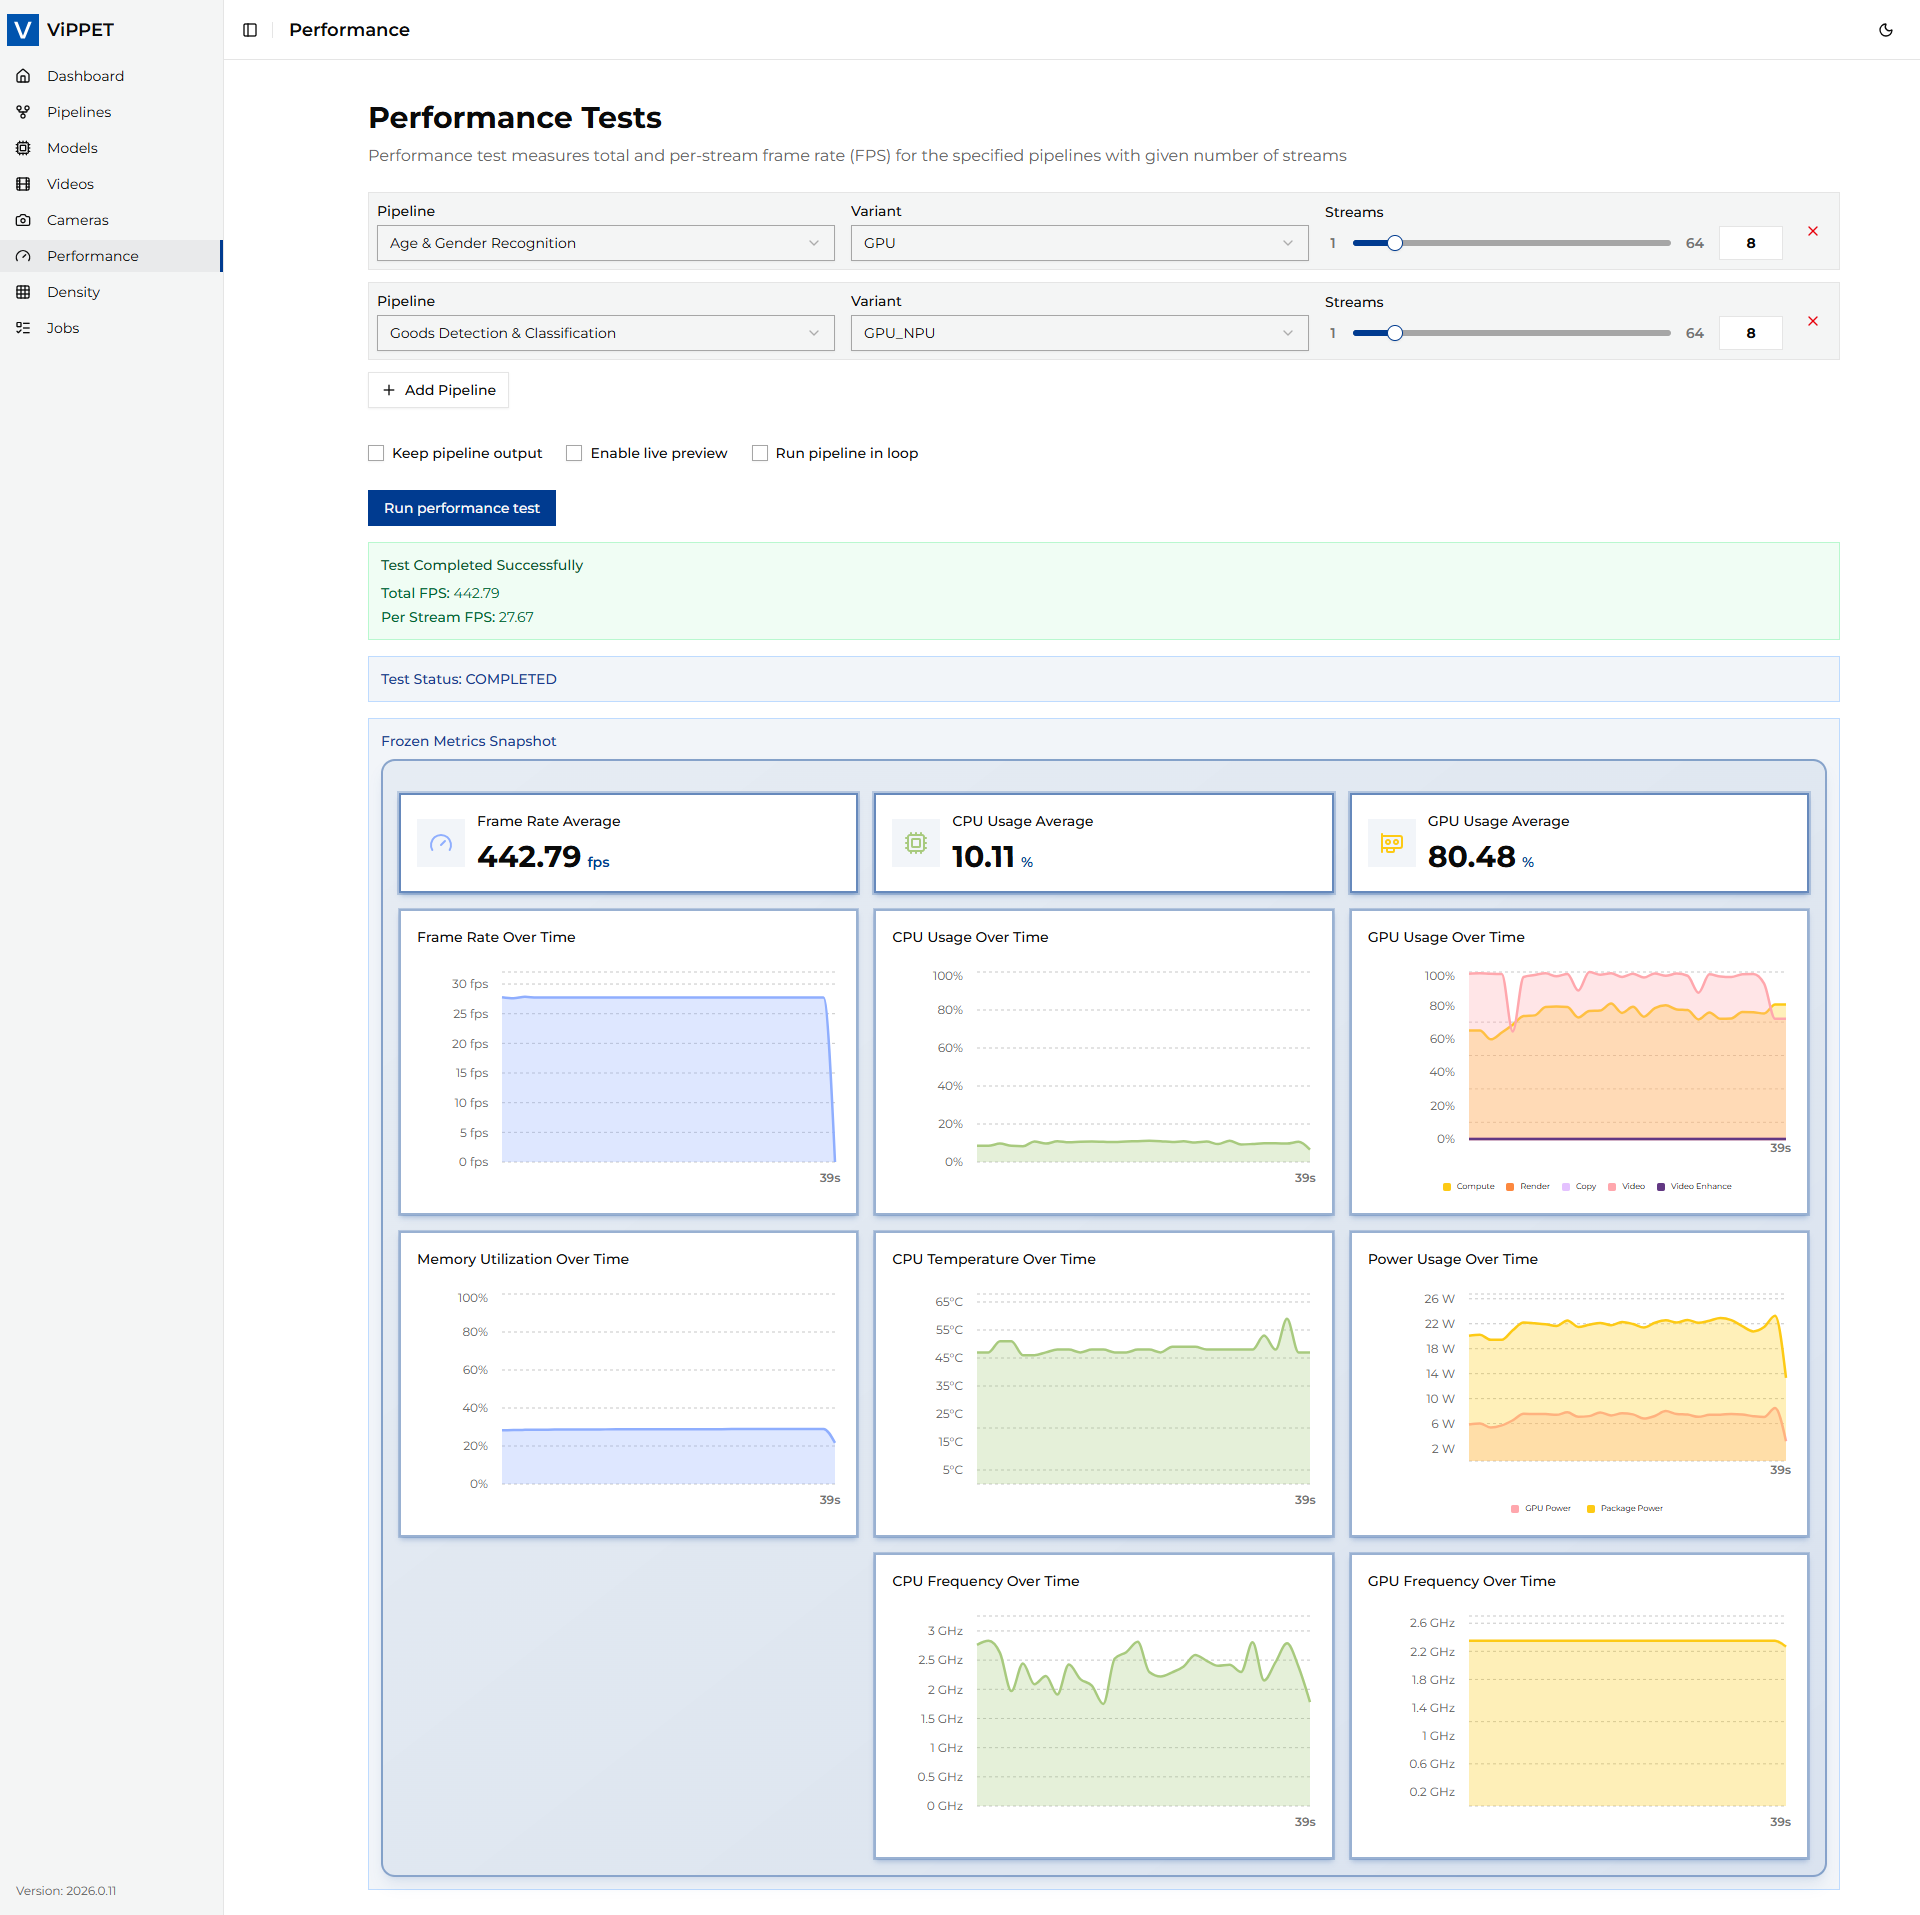
Interpreting results#
When the test completes, the application reports:
Metric |
Description |
|---|---|
Total FPS |
Aggregate throughput across all streams |
Per Stream FPS |
Average throughput per individual stream (Total FPS ÷ stream count) |
Output videos |
Paths to recorded output files (if output mode was |
Live stream URLs |
RTSP URLs for live viewing (if output mode was |
Latency (avg / min / max) |
End-to-end pipeline latency in milliseconds, reported when latency metrics are enabled |
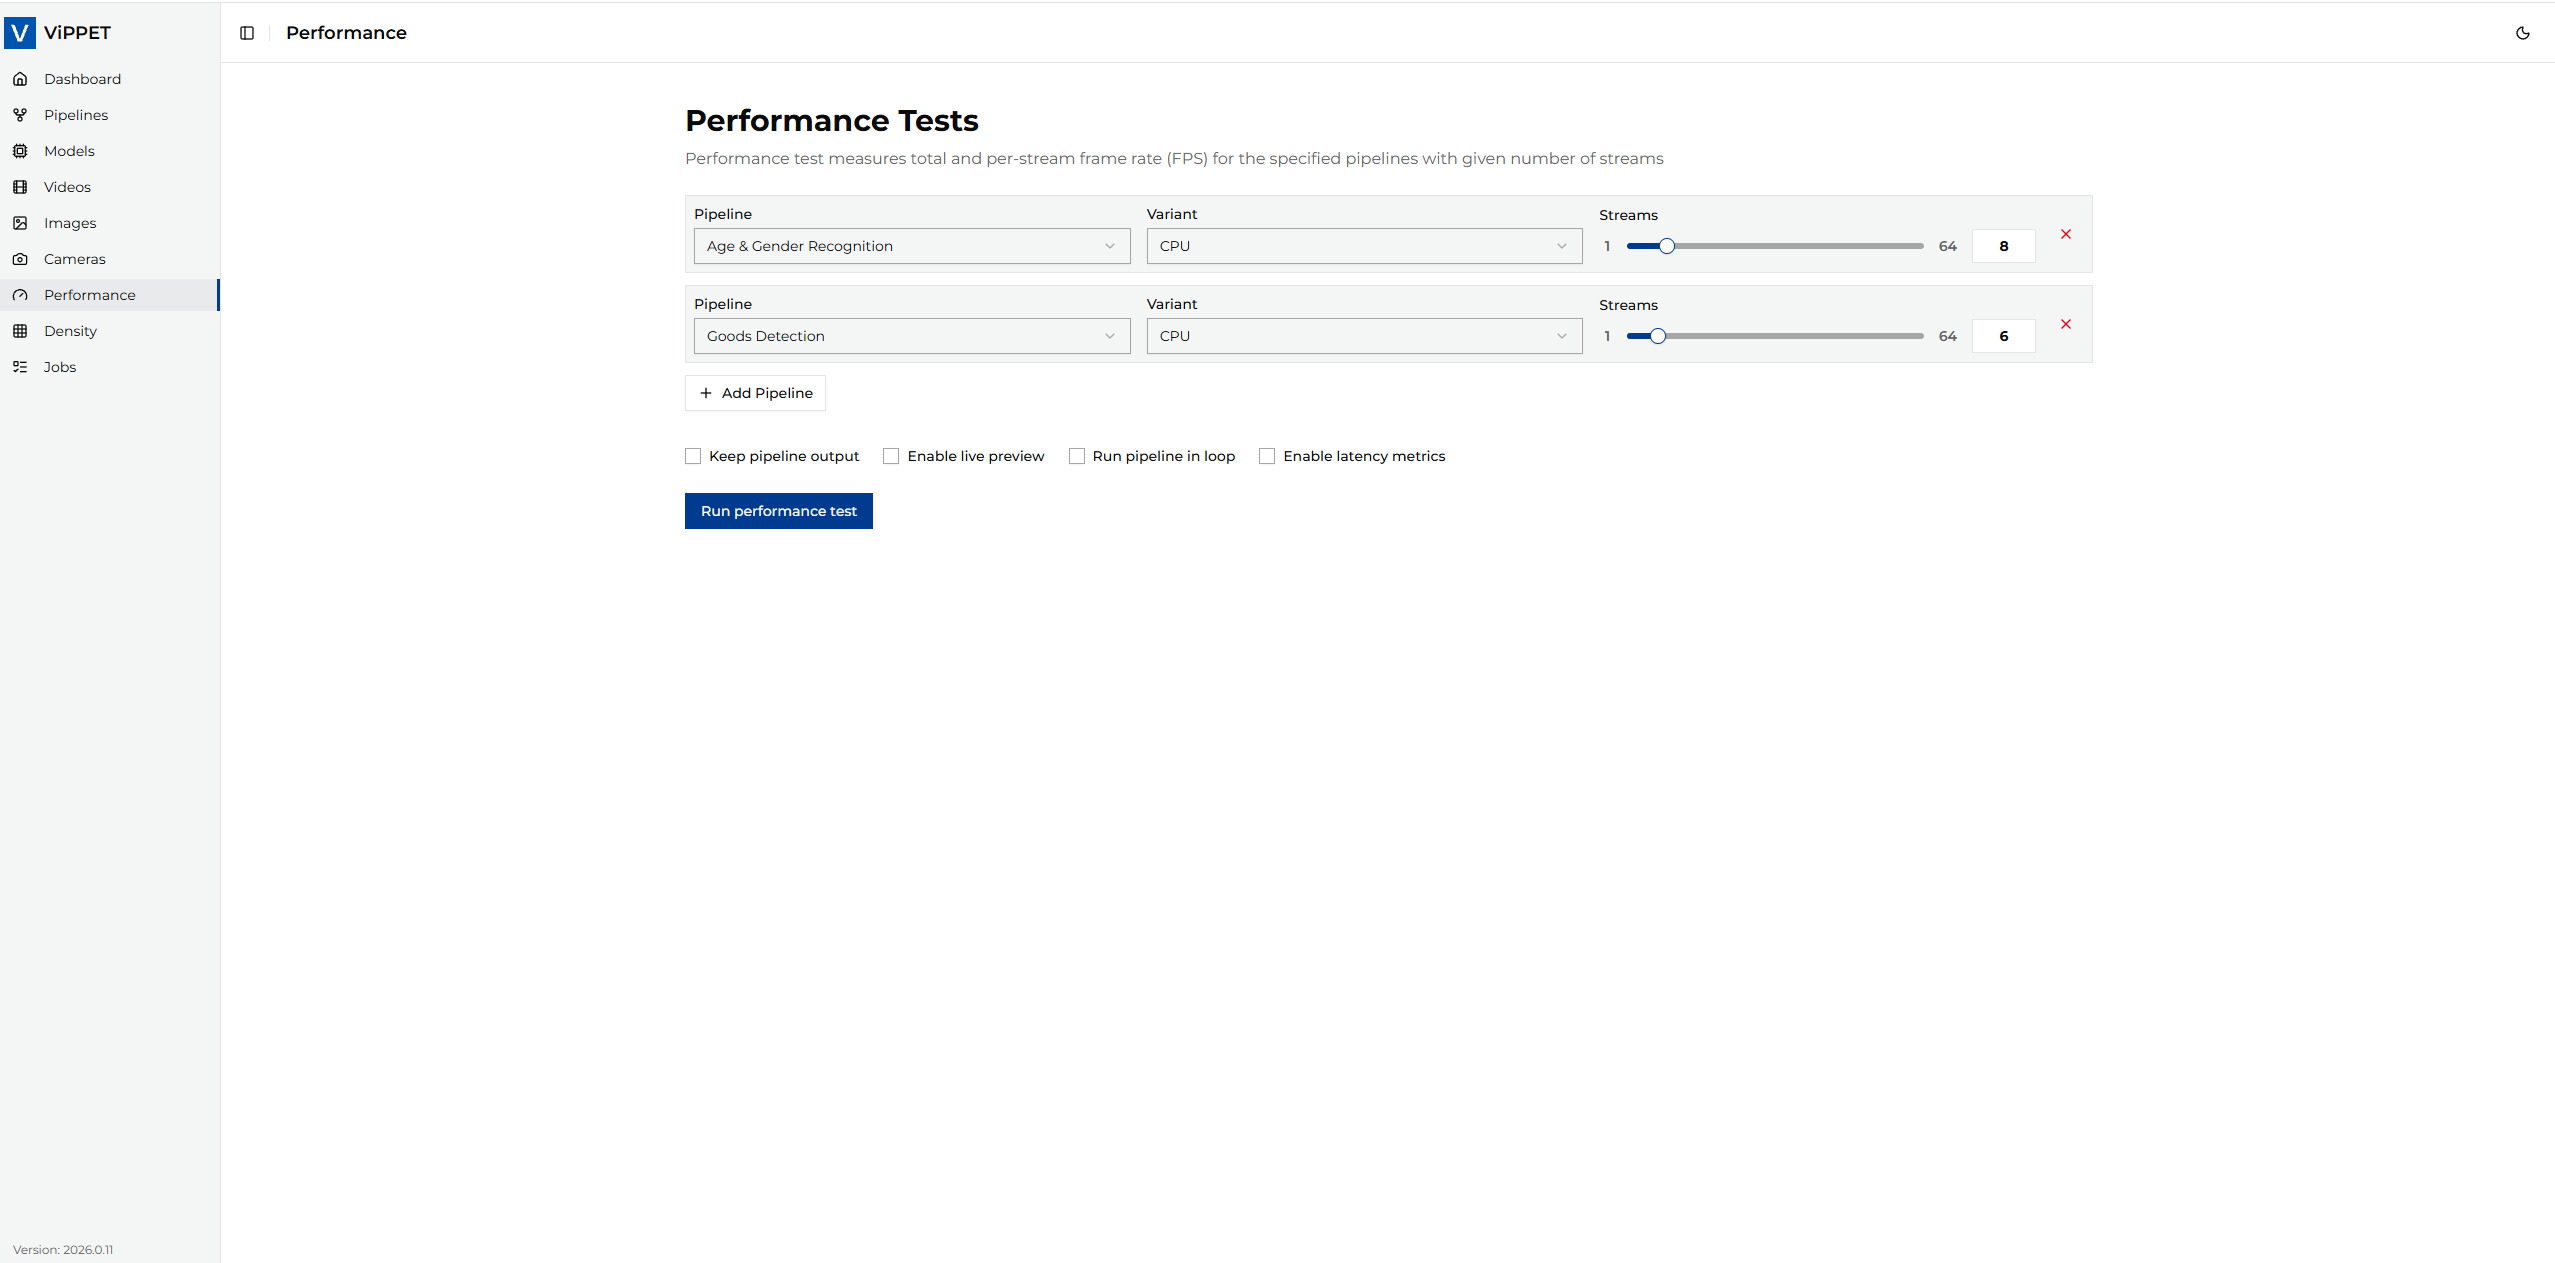
Test multiple pipelines#
You can test multiple pipelines running concurrently to simulate a realistic multi-workload scenario.
Select a pipeline from the list.
Click + Add Pipeline to add additional pipelines.
Configure the number of streams for each pipeline independently.
Set shared execution options (output mode, max runtime).
Click Run performance test.
While testing, real-time system metrics are displayed in the dashboard. The application reports Total FPS and Per Stream FPS metrics across all pipelines combined, and provides the output videos from the test if Save output was enabled.
Tip: Multi-pipeline tests are useful for understanding how different workloads compete for hardware resources. For example, you can test a detection pipeline alongside a classification pipeline to see how GPU utilization is shared.
Latency metrics#
Latency metrics show end-to-end pipeline processing time — how long each video frame takes to travel from the source element to the sink element. This helps you identify bottlenecks and evaluate whether a pipeline meets real-time requirements.
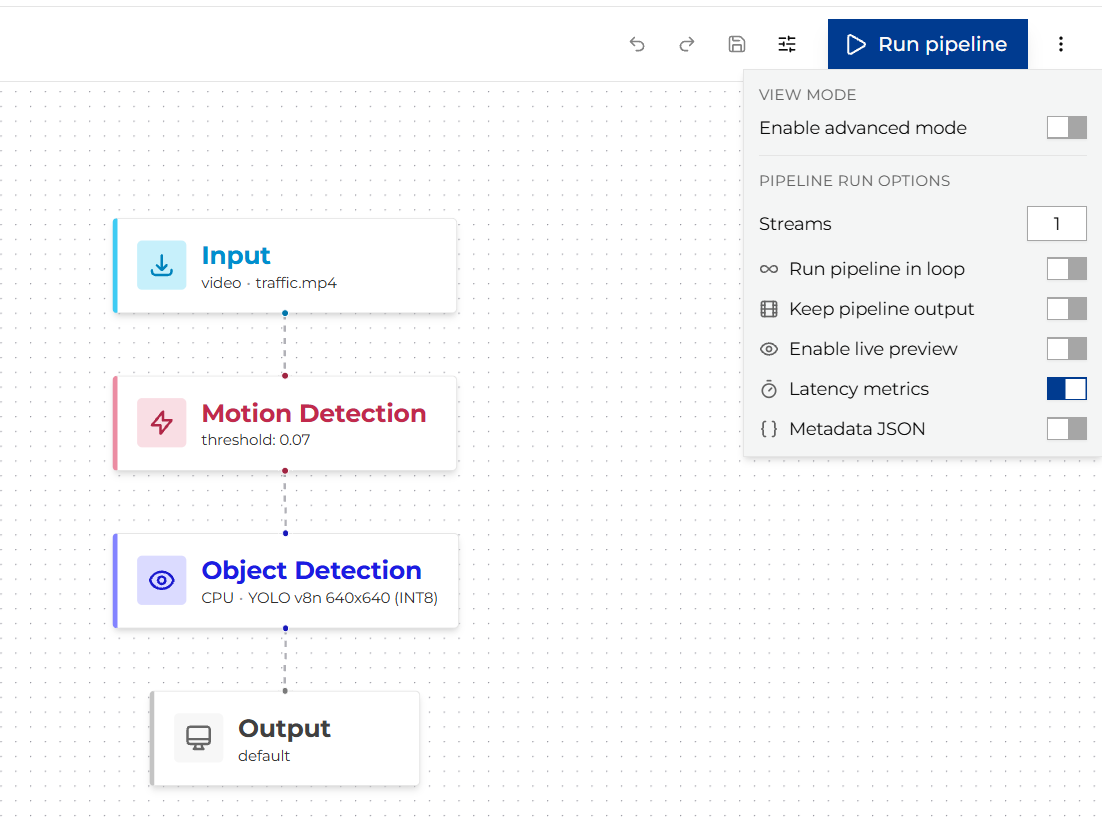
Enabling latency metrics#
To enable latency measurement for a pipeline run, set the Enable latency metrics toggle (or
enable_latency_metrics: true in the API request body) before starting the test.
When enabled, ViPPET configures GStreamer’s built-in latency_tracer which samples the pipeline every
1 000 ms and reports statistics for each interval.
Note: Enabling latency metrics adds minimal overhead to the pipeline. The tracer operates passively — it timestamps buffers at the source and measures arrival time at the sink without modifying the data path.
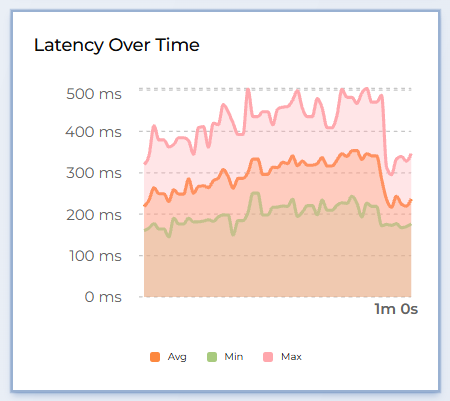
Reading the latency chart#
Once the pipeline is running with latency metrics enabled, the dashboard displays a real-time latency chart with three lines:
Metric |
Meaning |
|---|---|
avg (average) |
Mean buffer latency during the 1-second reporting interval. This is the most representative value for overall pipeline responsiveness. |
min (minimum) |
Shortest buffer latency observed in the interval. Represents the best-case processing time. |
max (maximum) |
Longest buffer latency observed in the interval. Spikes here indicate occasional stalls (e.g., model inference on a complex frame, I/O contention). |
All values are reported in milliseconds (ms).
How to interpret the values:
Stable avg close to min — the pipeline processes frames consistently with little variation.
Large gap between min and max — some frames take significantly longer than others. This may indicate bursty inference workloads or resource contention with other streams.
Rising avg over time — the pipeline may be experiencing back-pressure (e.g., the system is becoming saturated as more streams are added).
avg below target frame interval — the pipeline meets real-time requirements. For example, if your target is 30 FPS, the frame interval is ~33 ms; an avg latency below 33 ms means the pipeline keeps up.
Latency in multi-stream tests#
When running multiple streams, latency is reported per stream (identified by source → sink element pair). The chart displays all streams simultaneously so you can compare their behavior and detect uneven resource allocation.