View System Performance Dashboard#
The System Performance Dashboard in Grafana visualizes real-time system hardware metrics collected by the metrics-manager and scraped by Prometheus.
Open the Dashboard in Grafana#
For Docker#
Open https://<HOST_IP>/grafana/ in your browser and log in
with the default credentials (admin / admin).
For Helm#
Open https://<HOST_IP>:30443/grafana/ in your browser
and log in with the default credentials (admin / admin).
Navigate to the Dashboard#
Click Dashboards in the left sidebar.
Select System Performance Dashboard from the list.
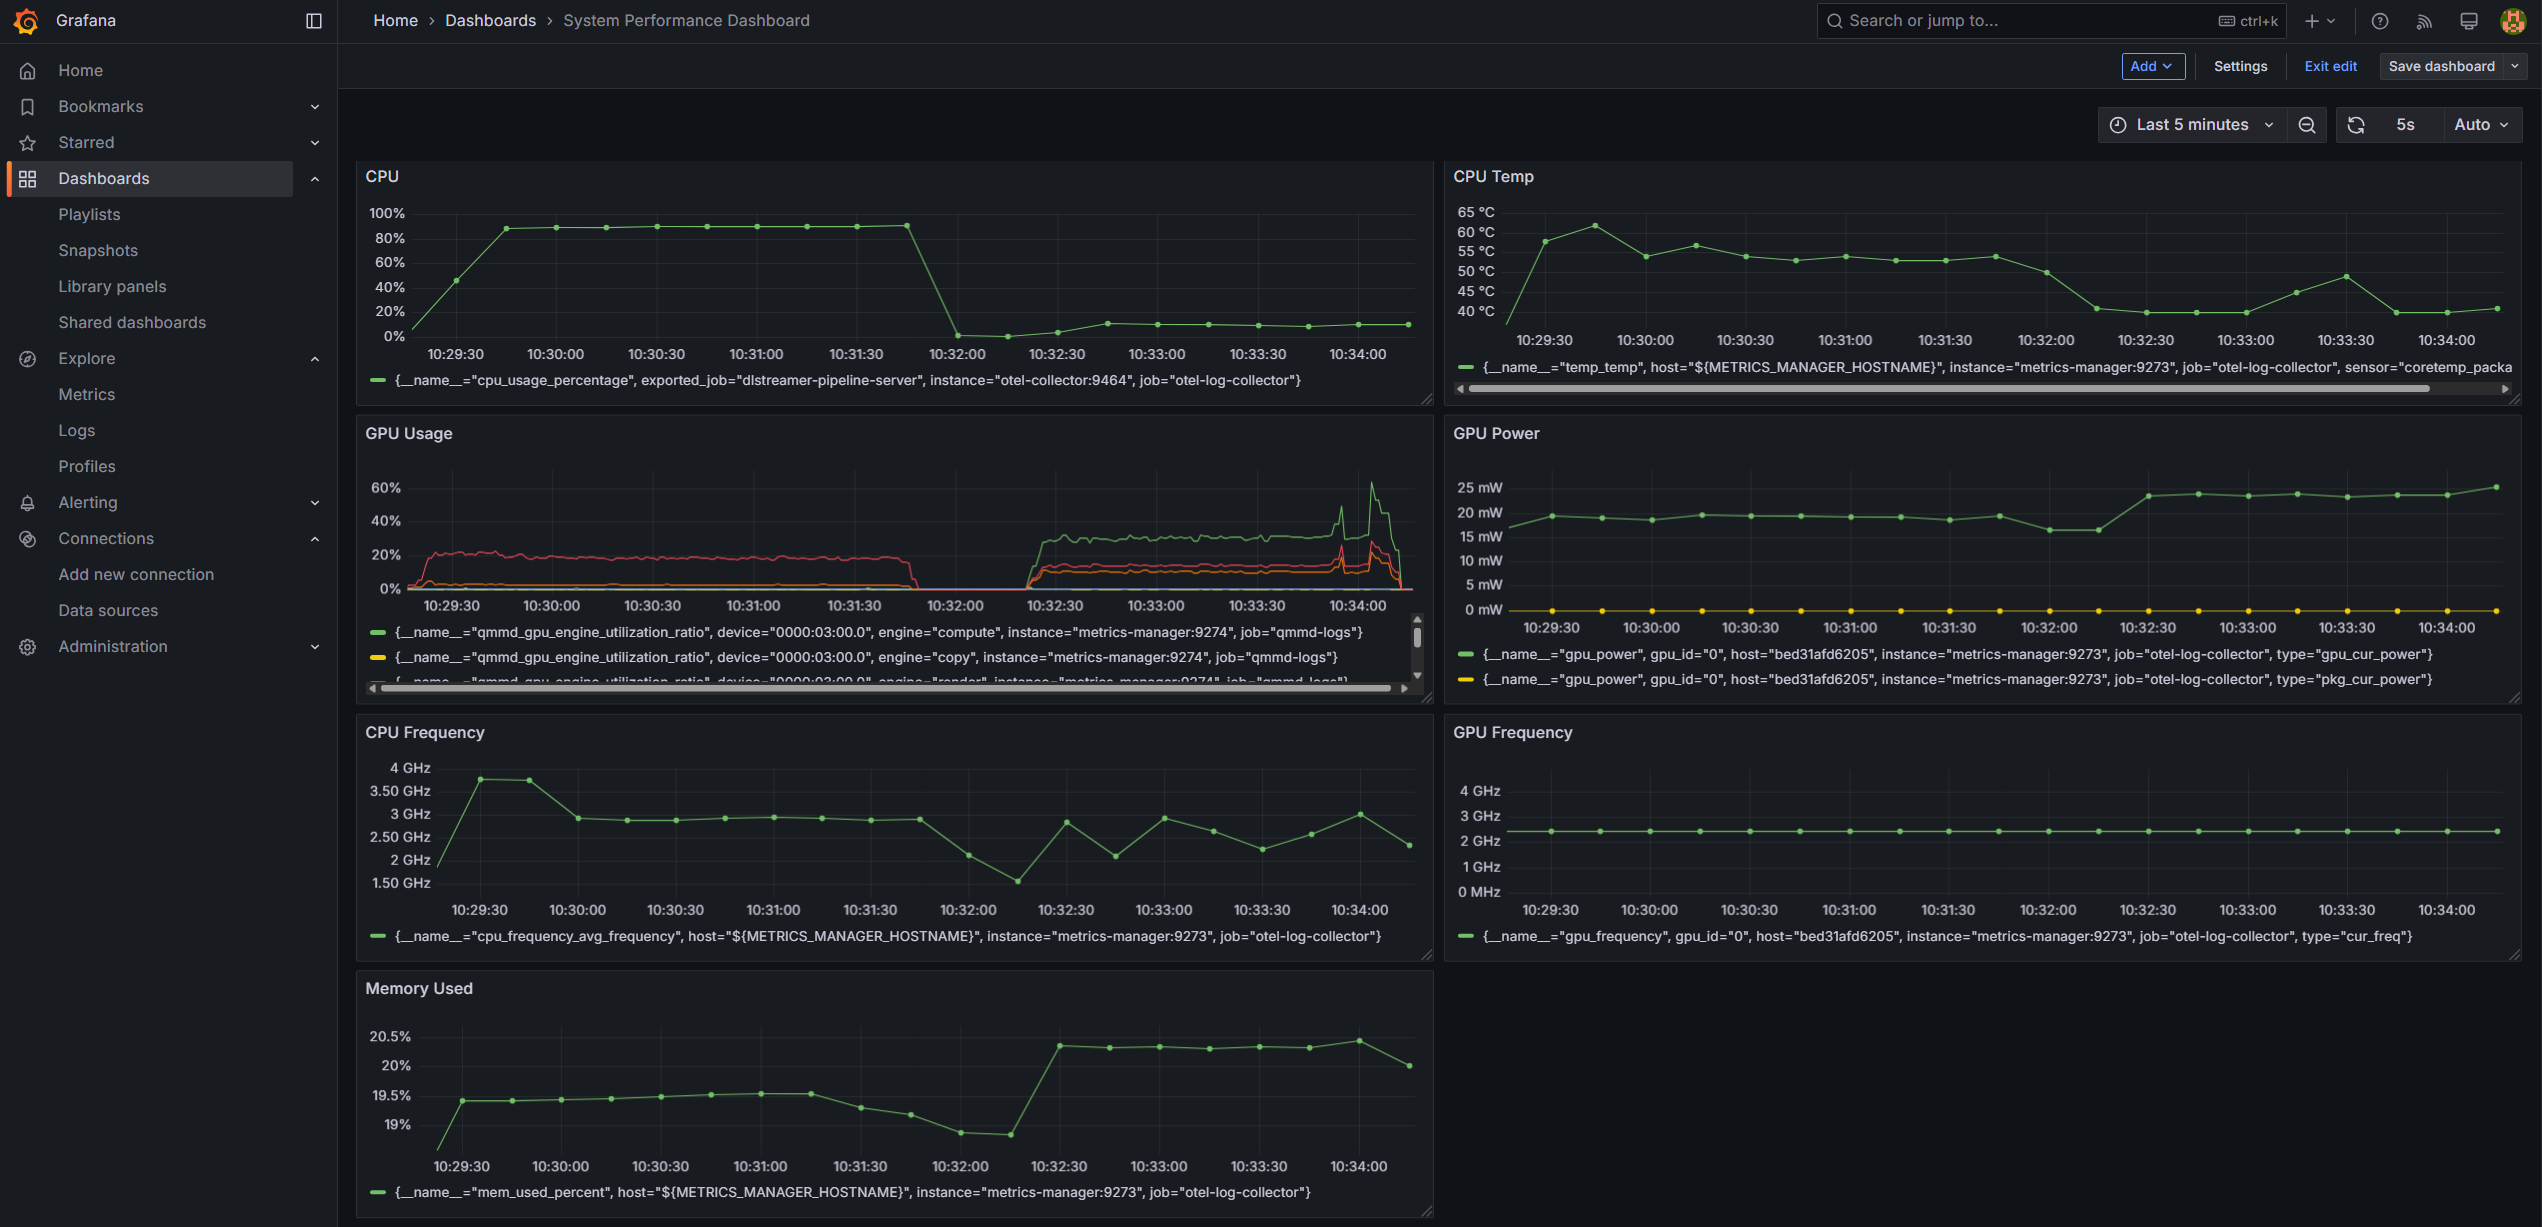 System performance metrics displayed in the System Performance Dashboard
Dashboard Panels#
Each panel displays a time-series graph for the last 5 minutes by default. The panels are:
CPU — tracks
cpu_usage_percentageover timeCPU Temp — tracks
temp_tempover timeCPU Frequency — tracks
cpu_frequency_avg_frequencyover timeGPU Usage — tracks
qmmd_gpu_engine_utilization_ratioover timeGPU Power — tracks
gpu_powerover timeGPU Frequency — tracks
gpu_frequencyover timeMemory Used — tracks
mem_used_percentover time
Note: Use the time picker in the top-right corner of Grafana to adjust the time range (for example, last 15 minutes or last 1 hour).