Vision Use Case#
The application is served with several predefined pipelines that cover different vision use cases:
License Plate Recognition - A solution that supports license plate recognition, vehicle detection with attribute classification, and other object detection and classification tasks, adaptable based on the selected model.
Smart Parking - A cloud-native, microservices-based video analytics pipeline that uses pre-trained deep learning models to detect parking-space occupancy.
Smart VNR - Processes video streams with AI-based analytics, including object detection, tracking, and classification. Outputs include video recording, metadata, and processed video frames.
Motion Detection - Identifies regions of motion, then runs object detection restricted to those motion ROIs.
Goods Detection - Uses object detection to identify various retail-related objects, making it suitable for inventory management, customer behavior analysis, and other retail use cases.
Defect Detection - Uses machine vision for automatic pallet defect detection, enabling efficient quality control in manufacturing.
Age & Gender Recognition - Detects faces and predicts age groups and gender, making it suitable for customer demographics analysis and other retail use cases.
Vision pipelines are constructed using Object Detection and Object Classification blocks. Both are supplied with models to perform their respective tasks.
Step 2. Configure the vision element#
In the Pipeline Builder, click the Object Detection node to open its configuration panel.
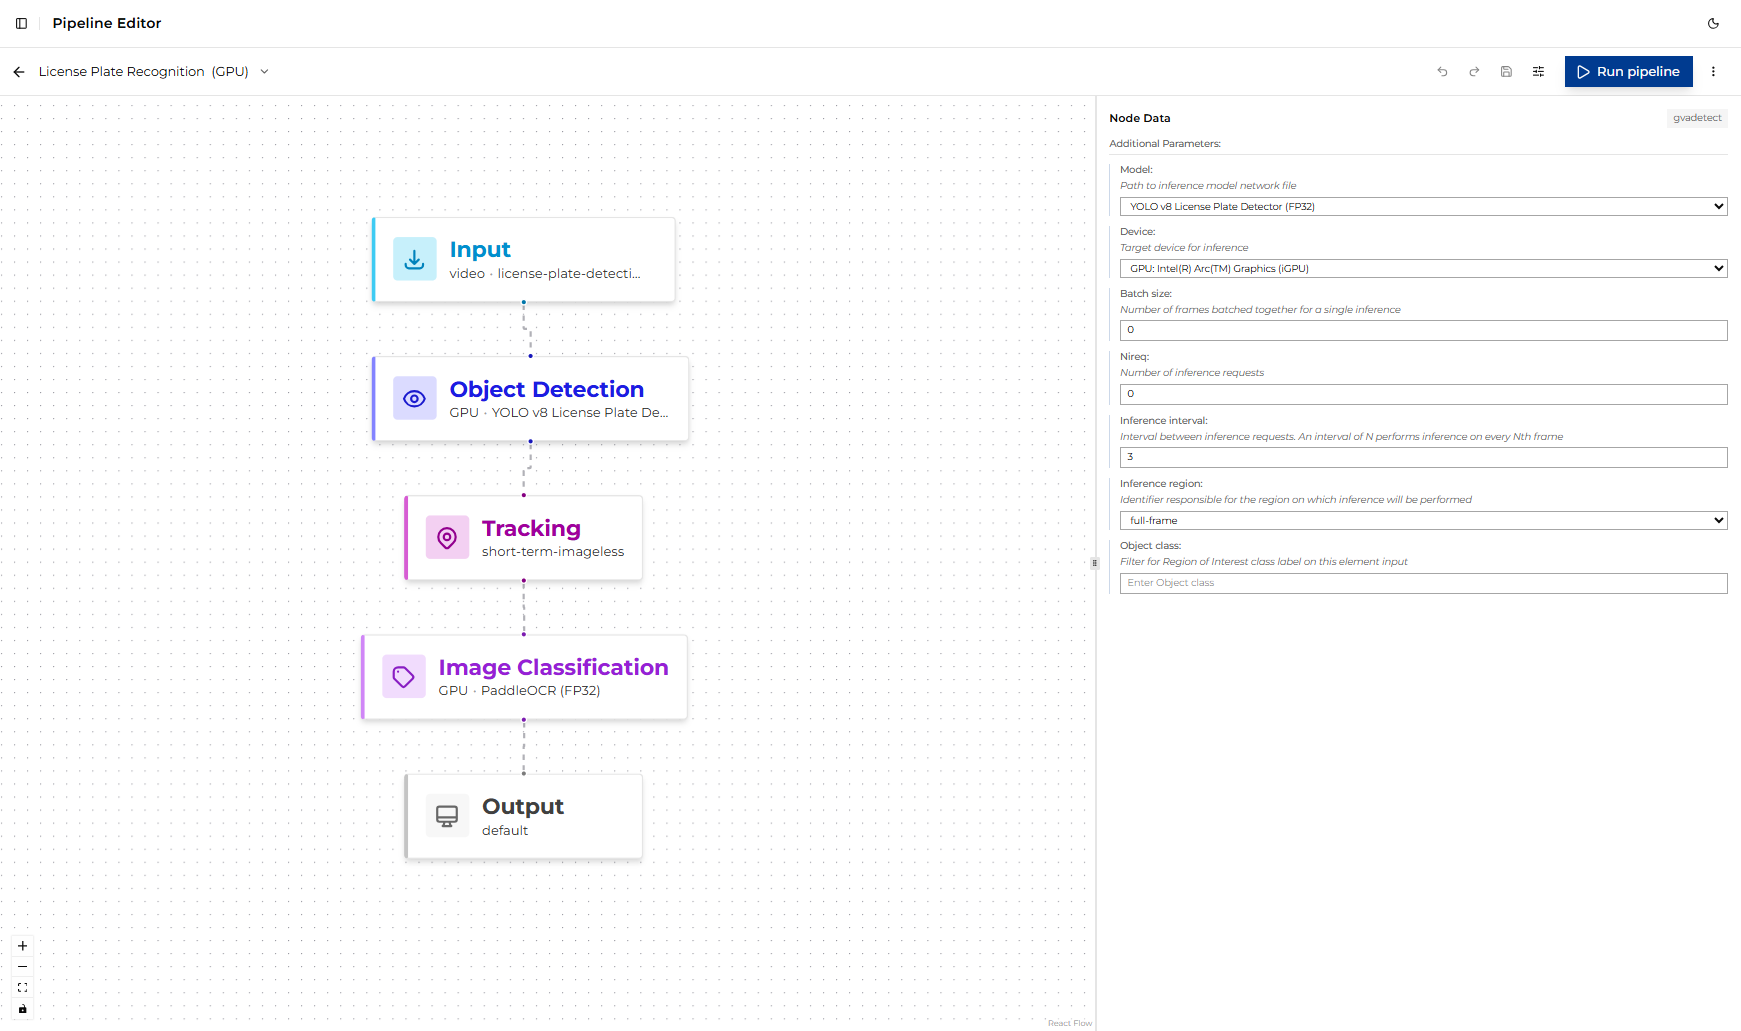
The following parameters are exposed in the UI (defaults shown reflect the predefined pipeline):
Parameter |
Default |
Description |
|---|---|---|
model |
|
Model used by the element for inference. Choose a model compatible with the selected element type and target device to balance accuracy and throughput. |
device |
|
Target inference device. Set automatically by the selected variant; use the variant switcher to change devices rather than editing this field directly. |
batch size |
|
Number of frames batched together for a single inference. |
nireq |
|
Number of inference requests. |
inference interval |
|
Interval between inference requests. An interval of N performs inference on every Nth frame. |
inference region |
|
Identifier responsible for the region on which inference will be performed. |
object class |
(empty) |
Filter for the Region of Interest class label on this element input. Leave empty to process all classes. |
Next, click Image Classification. It exposes the same parameters shown in the table above.
The default model for the classification block is ResNet-18 ImageNet (FP32), which performs
general-purpose image classification. You can switch to a different model if you want to evaluate
how model selection impacts performance across different hardware.
The inference region is set to roi-list.
Step 3. Run the pipeline#
Confirm that the input video is available under the shared
videos/input/directory (the default pipeline useslicense-plate-detection.mp4).Click Run. ViPPET launches the pipeline as a job; you can follow progress in the Jobs view.
While the job runs, the selected device’s utilization (CPU/GPU/NPU) should increase visibly in the Dashboard.
Step 4. Interpret the results#
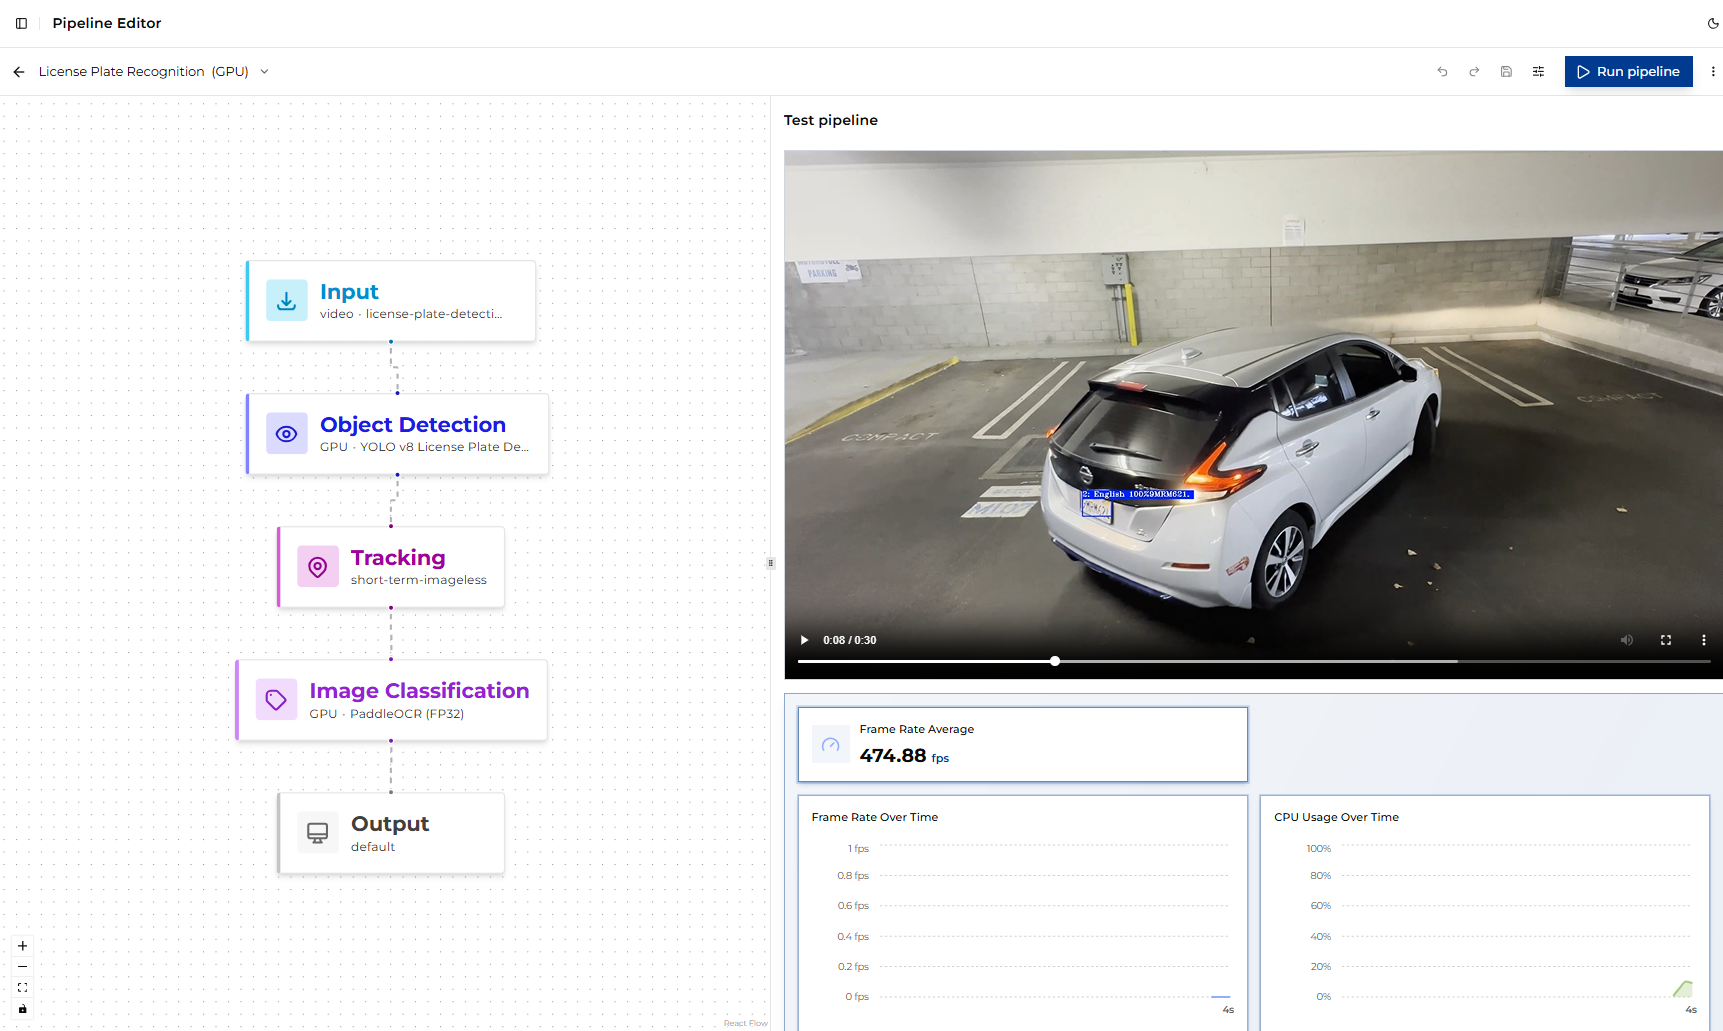
When the job completes, several outputs are available:
Output Video: the processed video with overlaid detections and classifications.
Average Frame Rate (FPS): Reported in the job details and visible on the Dashboard. This is the most important metric for comparing performance across hardware targets.
Inference Metrics: Several charts show utilization indicators, including CPU, GPU, NPU, memory usage, temperature, and power.
To evaluate the pipeline across hardware, re-run it with a different variant selected and compare the reported FPS and generated summaries.