How To Use ViPPET#
This page maps ViPPET UI sections to dedicated how-to articles.
Dashboard#
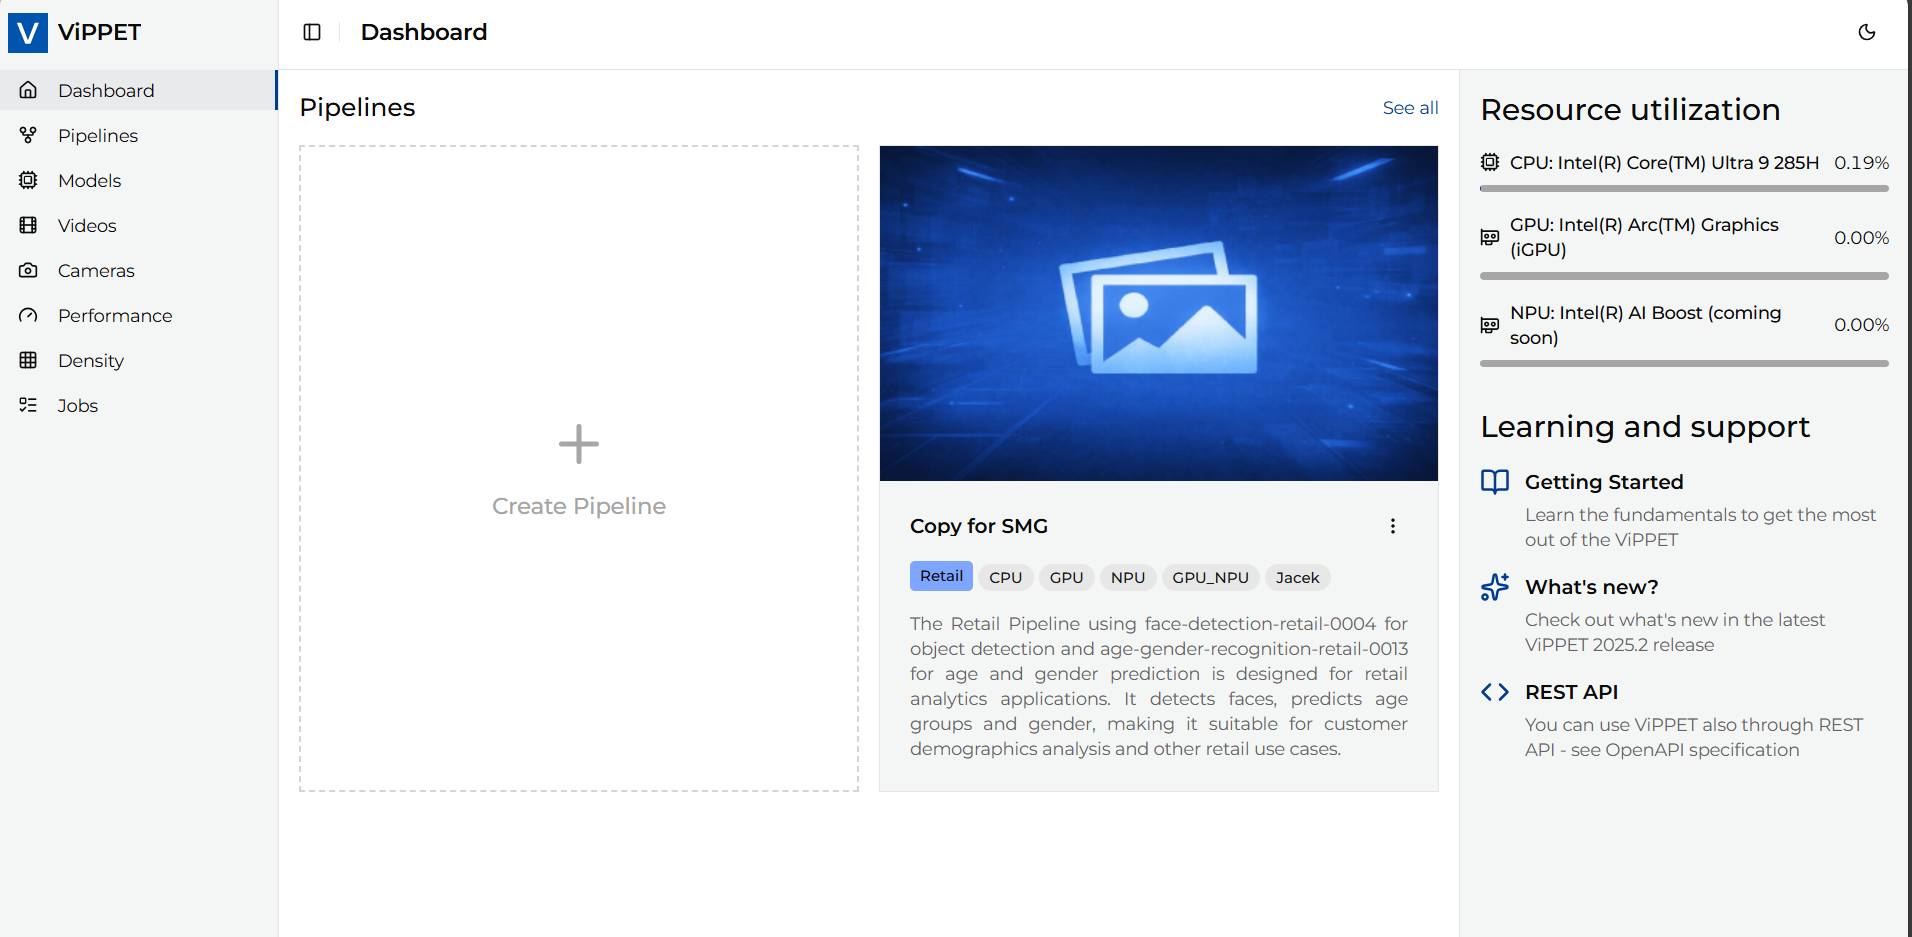 Figure 1: Dashboard section in ViPPET UI
Use this section to monitor current system and test activity from a single view. It provides a quick health snapshot before and during test execution.
Related article:
Models#
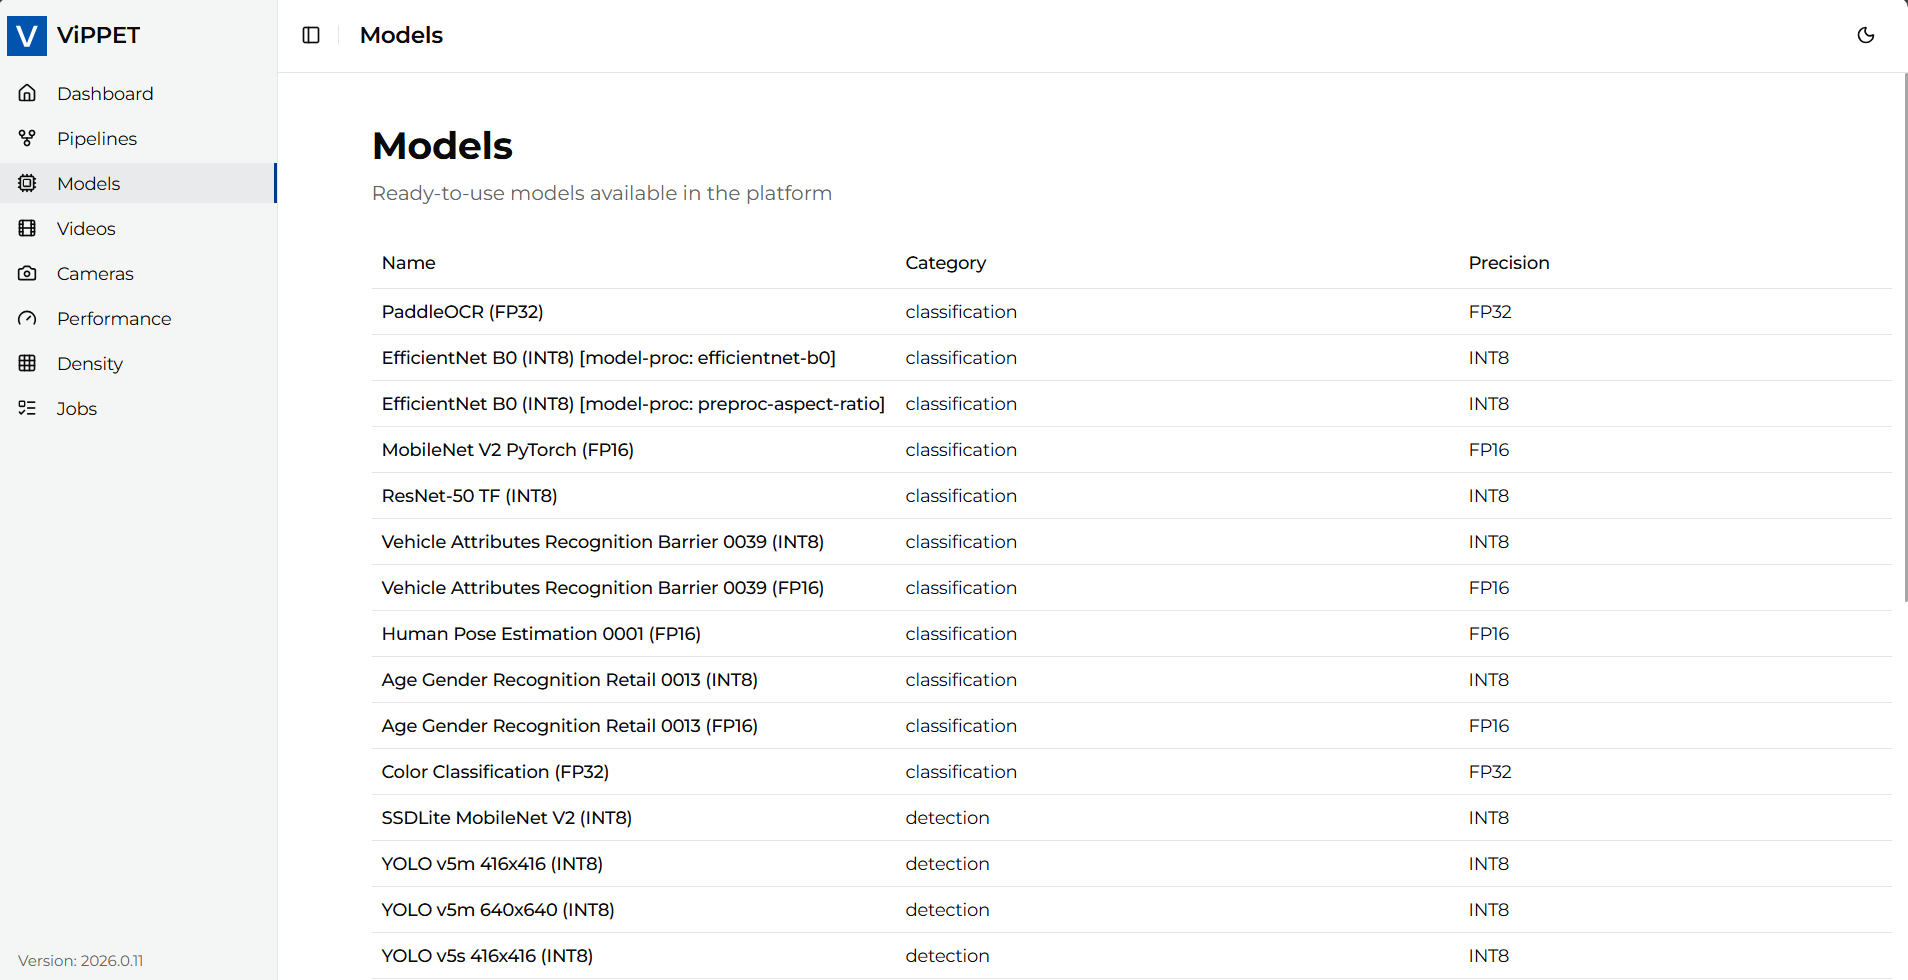 Figure 2: Models section in ViPPET UI
Use this section to review and manage AI models used by your pipelines. It helps keep model assets organized and ready for pipeline configuration.
Pipelines#
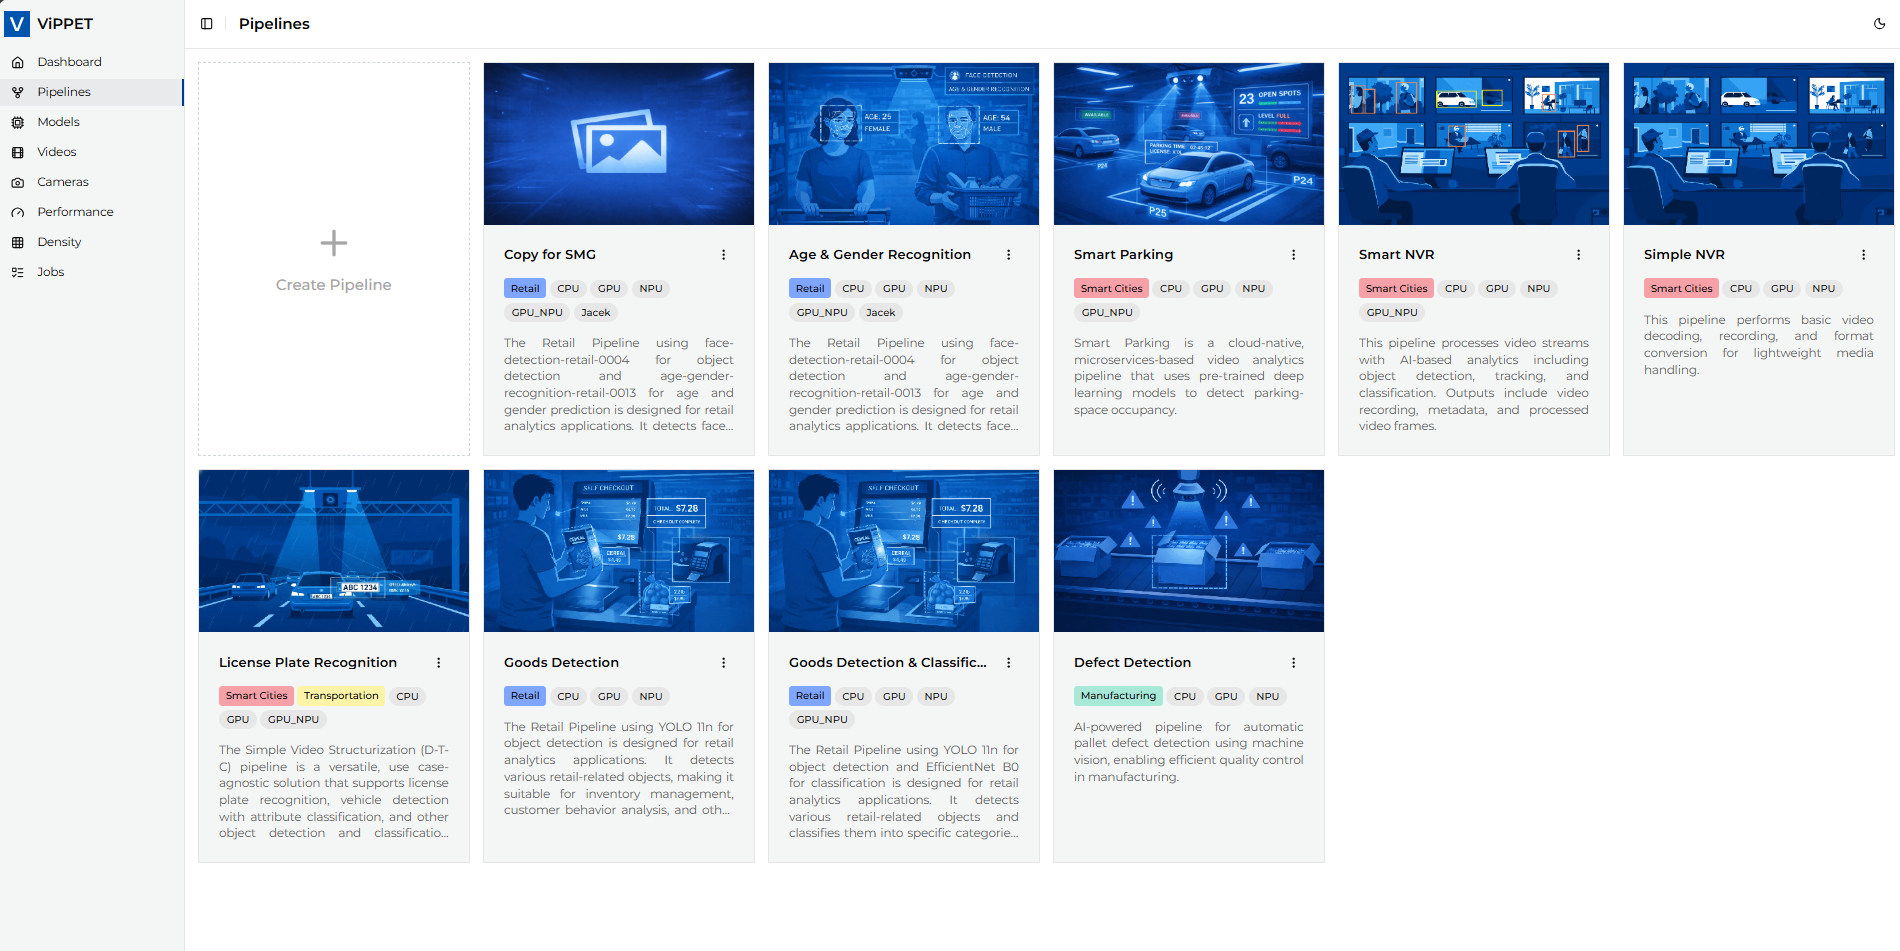 Figure 3: Pipelines section in ViPPET UI
Use this section to create, edit, and validate pipeline definitions. You can also adjust element parameters and prepare variants for testing.
Related article:
Performance#
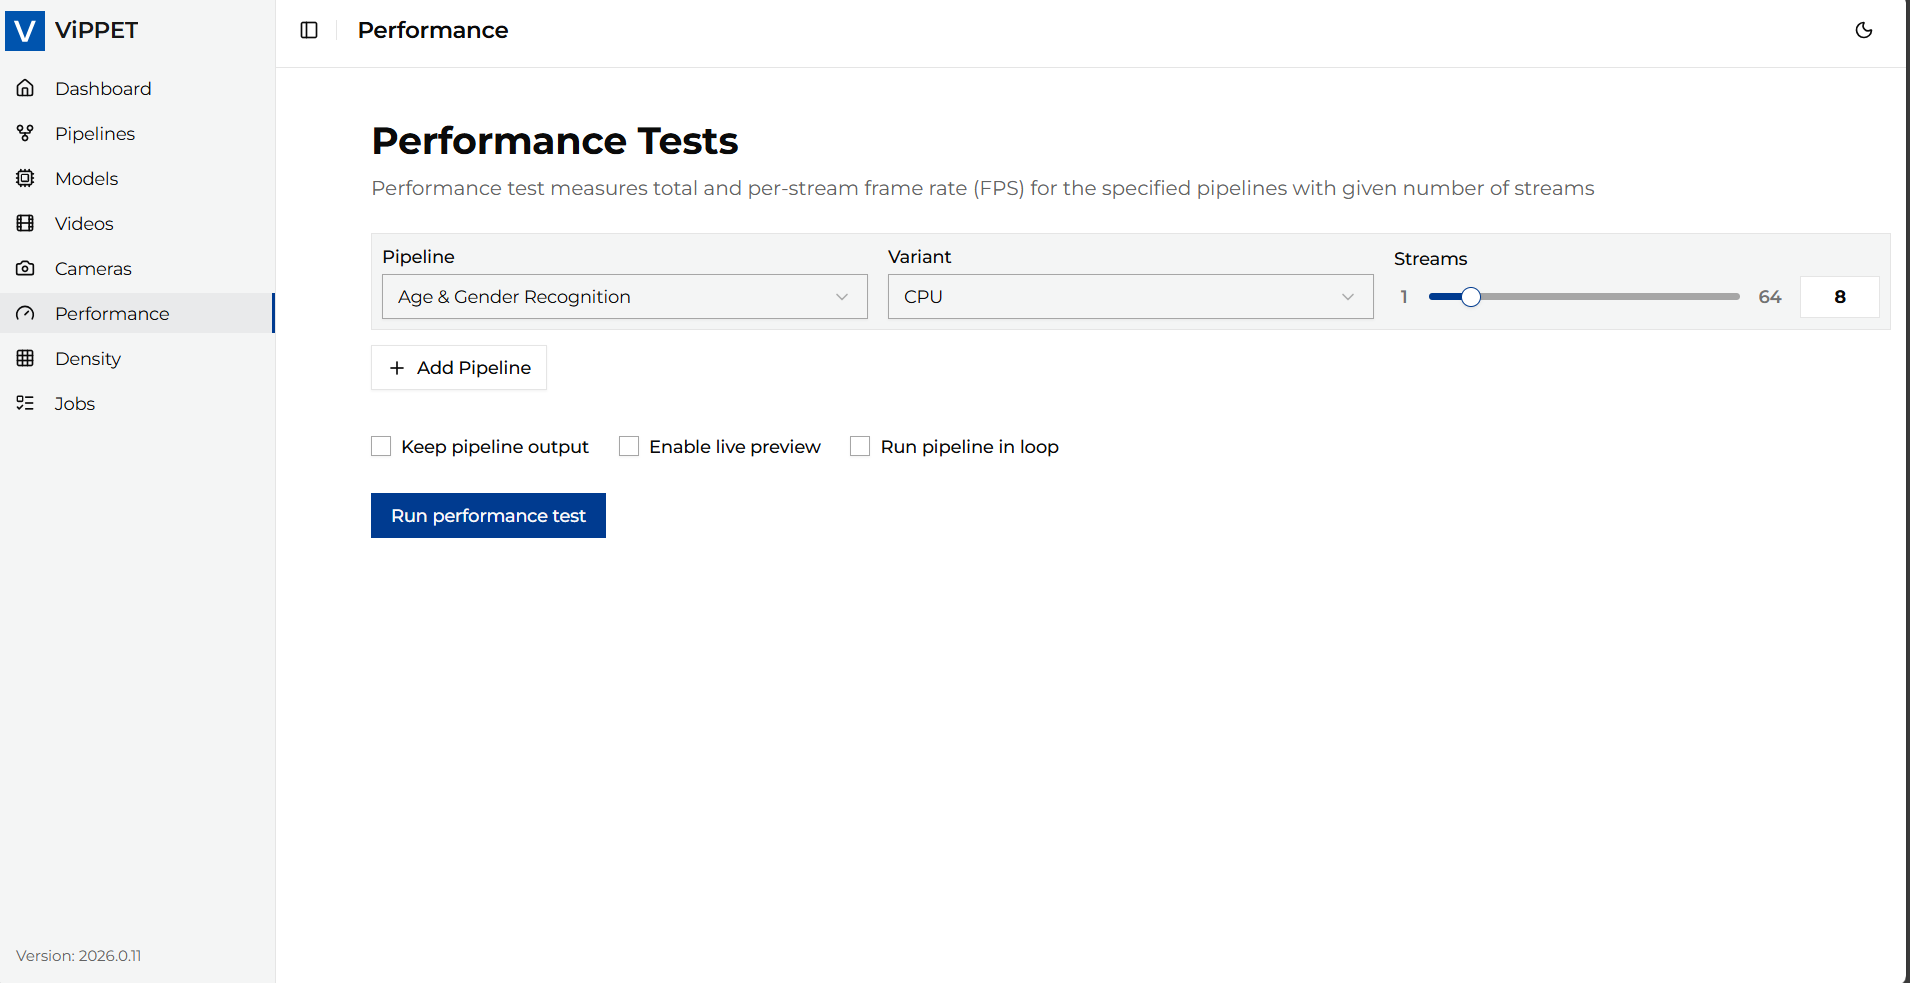 Figure 4: Performance section in ViPPET UI
Use this section to run fixed-stream performance benchmarks. It supports both single-pipeline and multi-pipeline concurrent testing.
Related article:
Density#
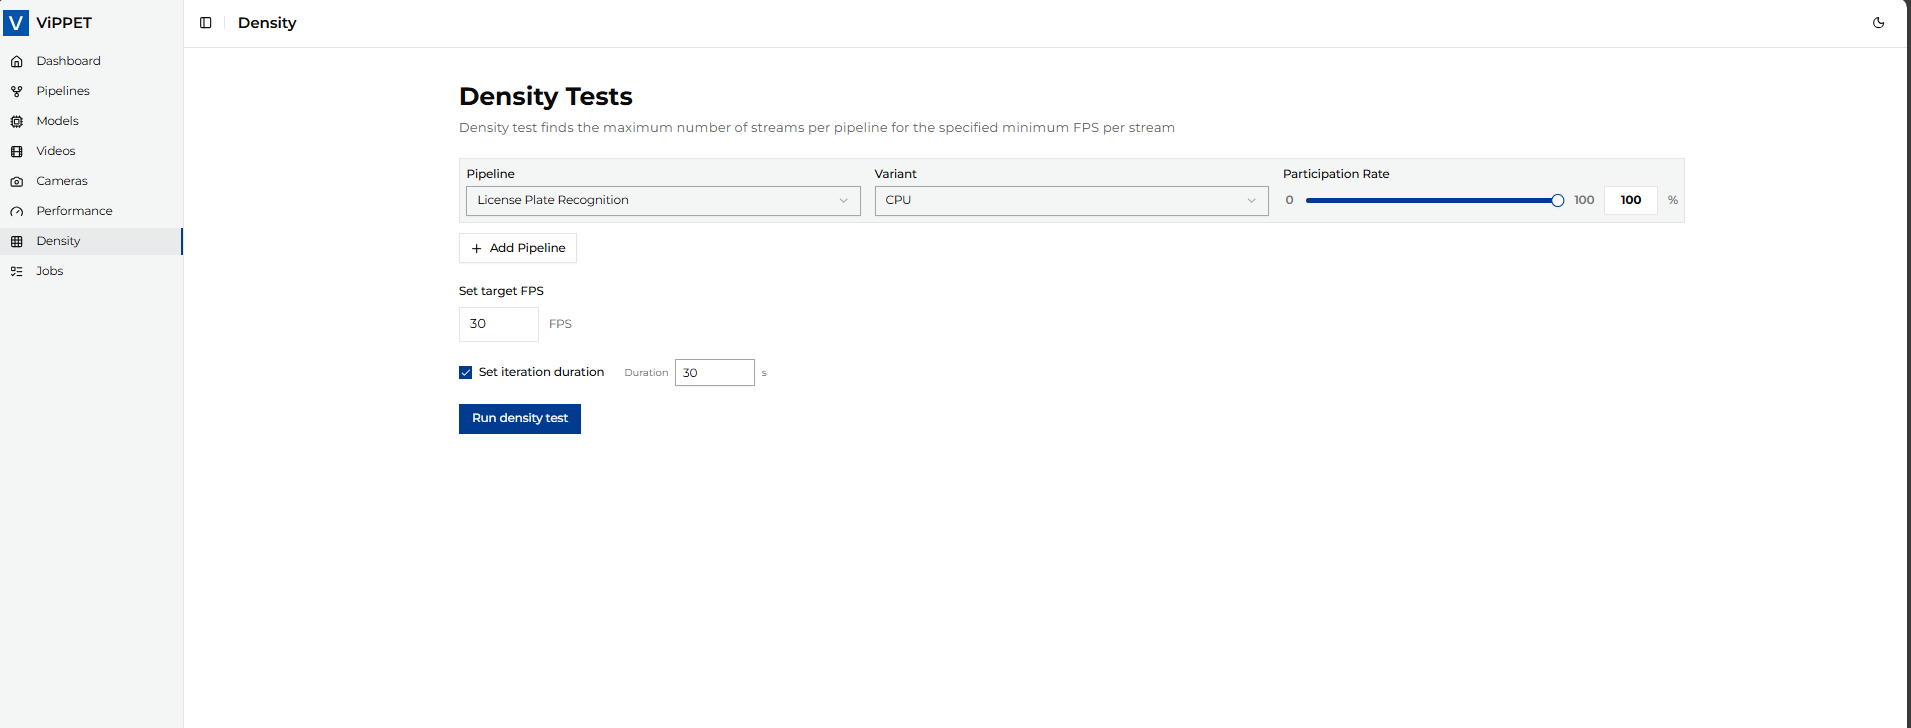 Figure 5: Density section in ViPPET UI
Use this section to find the maximum sustainable stream count for a target FPS floor. It is best suited for platform capacity planning and stream scaling decisions.
Related article:
Videos#
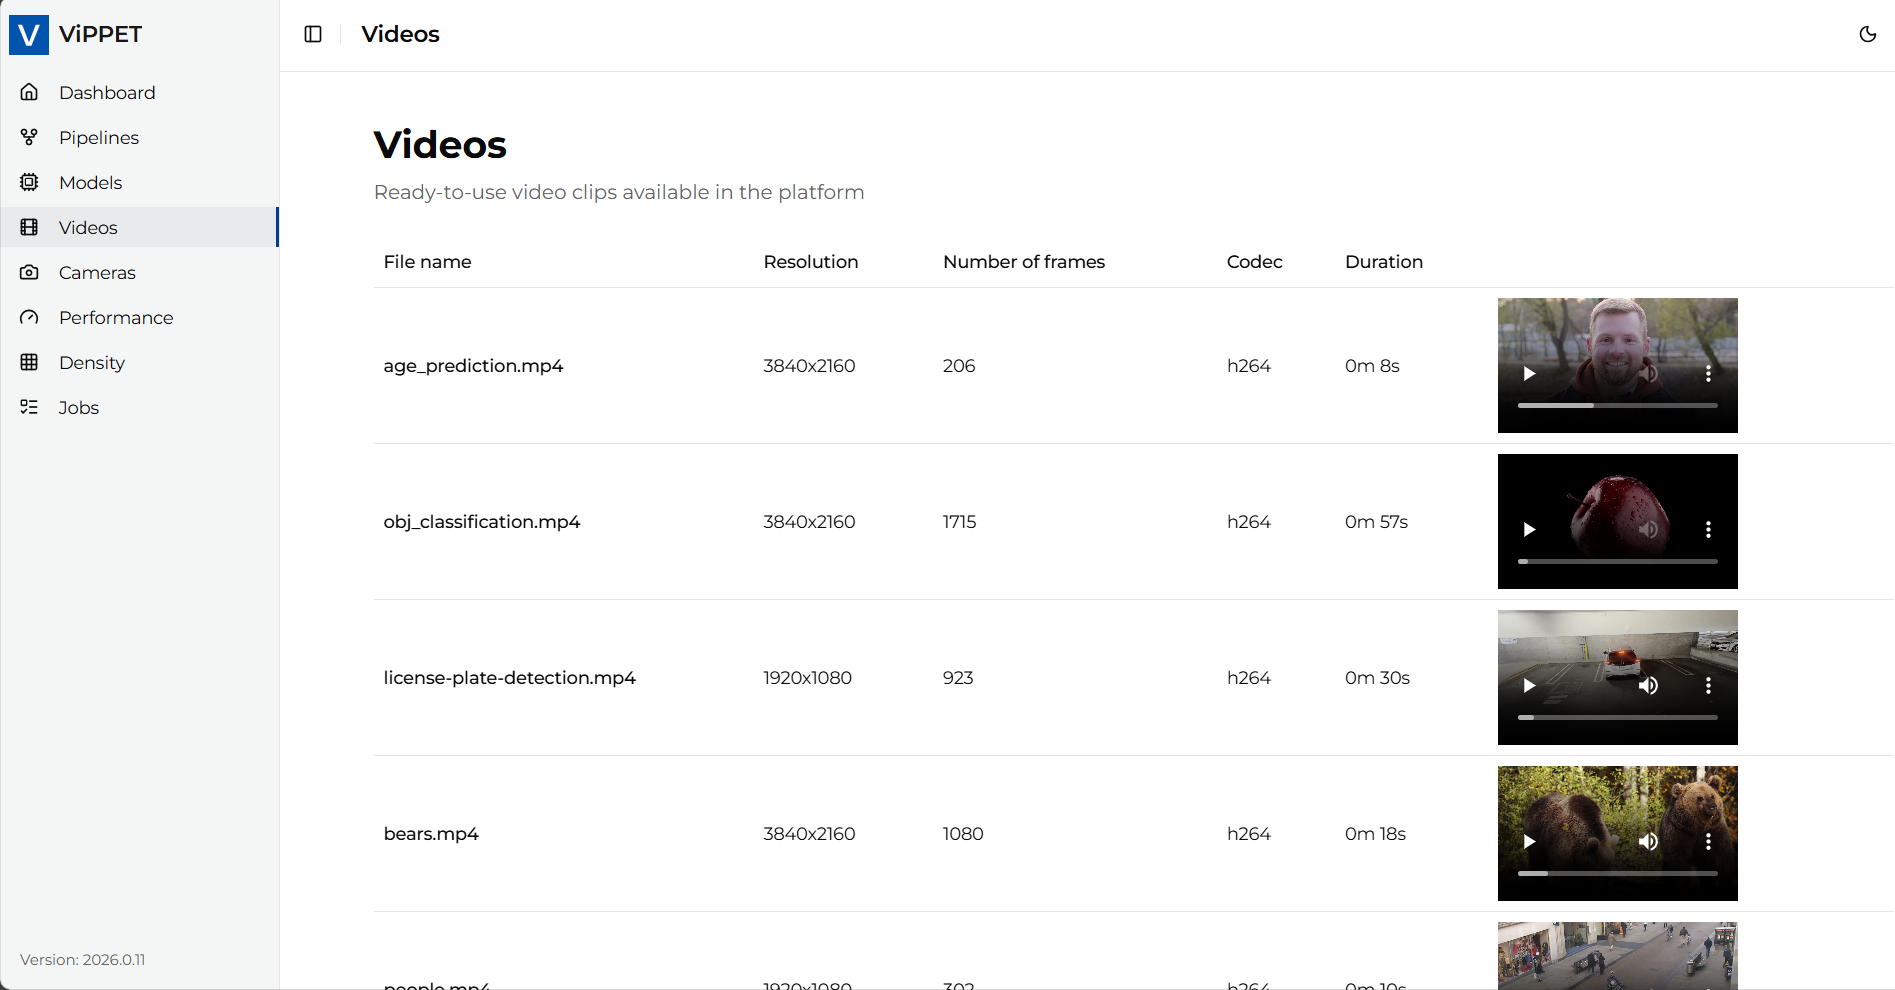 Figure 6: Videos section in ViPPET UI
Use this section to review outputs generated by tests and pipelines. It helps validate visual quality.
Related article:
Jobs#
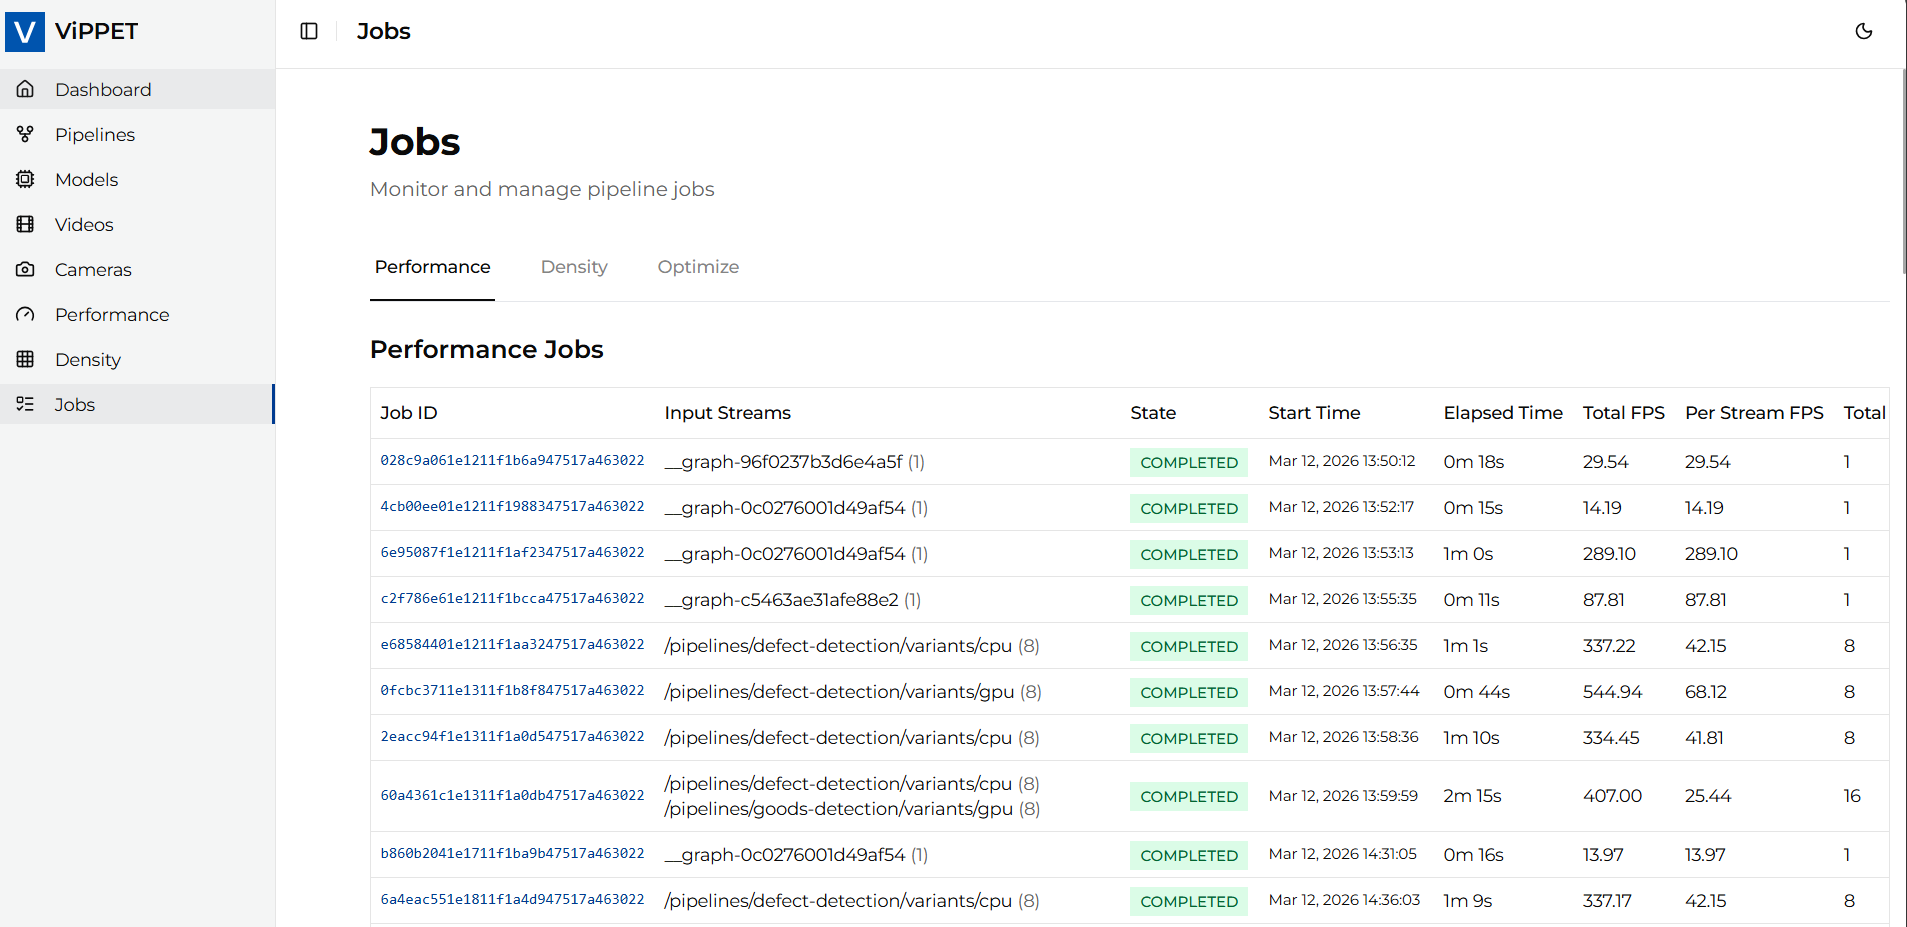 Figure 7: Jobs section in ViPPET UI
Use this section to track running and completed tasks. You can quickly verify status, timing, and completion history.
Cameras#
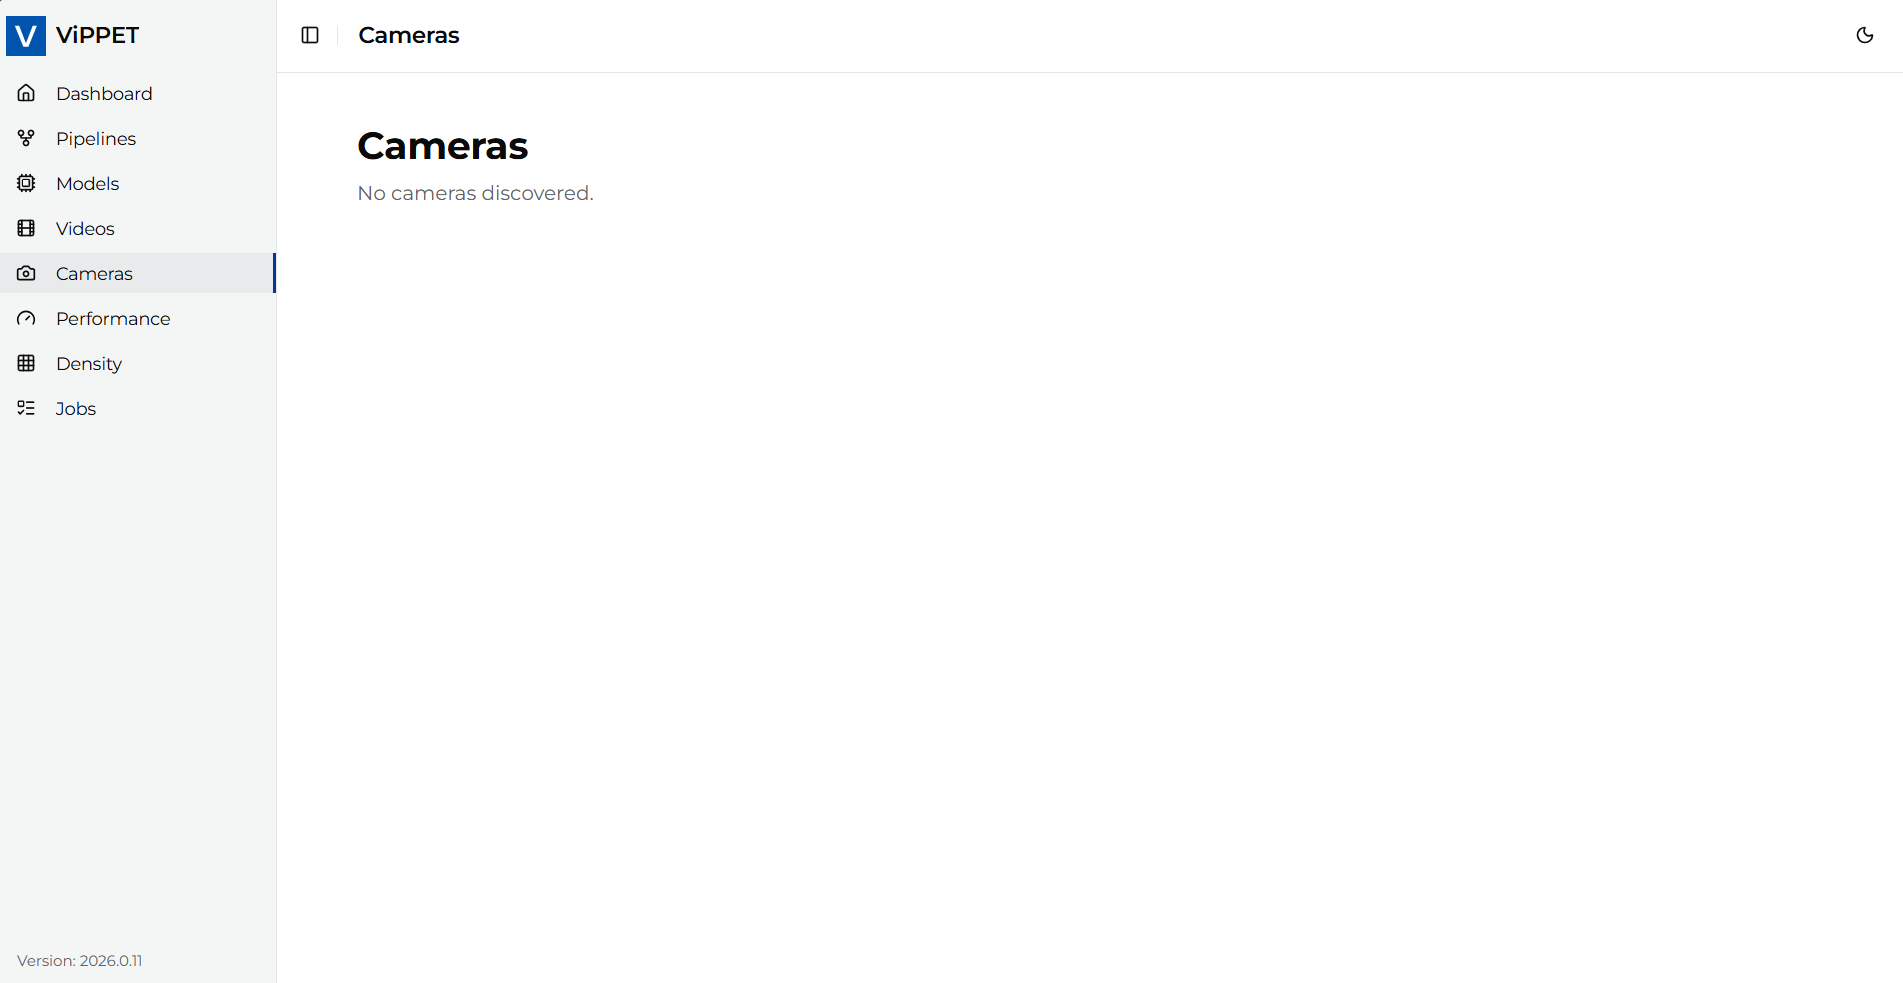 Figure 8: Cameras section in ViPPET UI
Use this section to manage camera-like inputs used by tests and pipelines.
Related article: