Analytics Pipeline (Downstream)#
Raw metadata is valuable, but actionable insights come from the Analytics Pipeline.
Node-RED Transformation#
Input: The MQTT IN Node subscribes to
scenescape/event/region/+/+/objects.Logic: The Function node aggregates counts per region and calculates Dwell Time (congestion).
Output: The InfluxDB OUT Node writes normalized data points to InfluxDB.

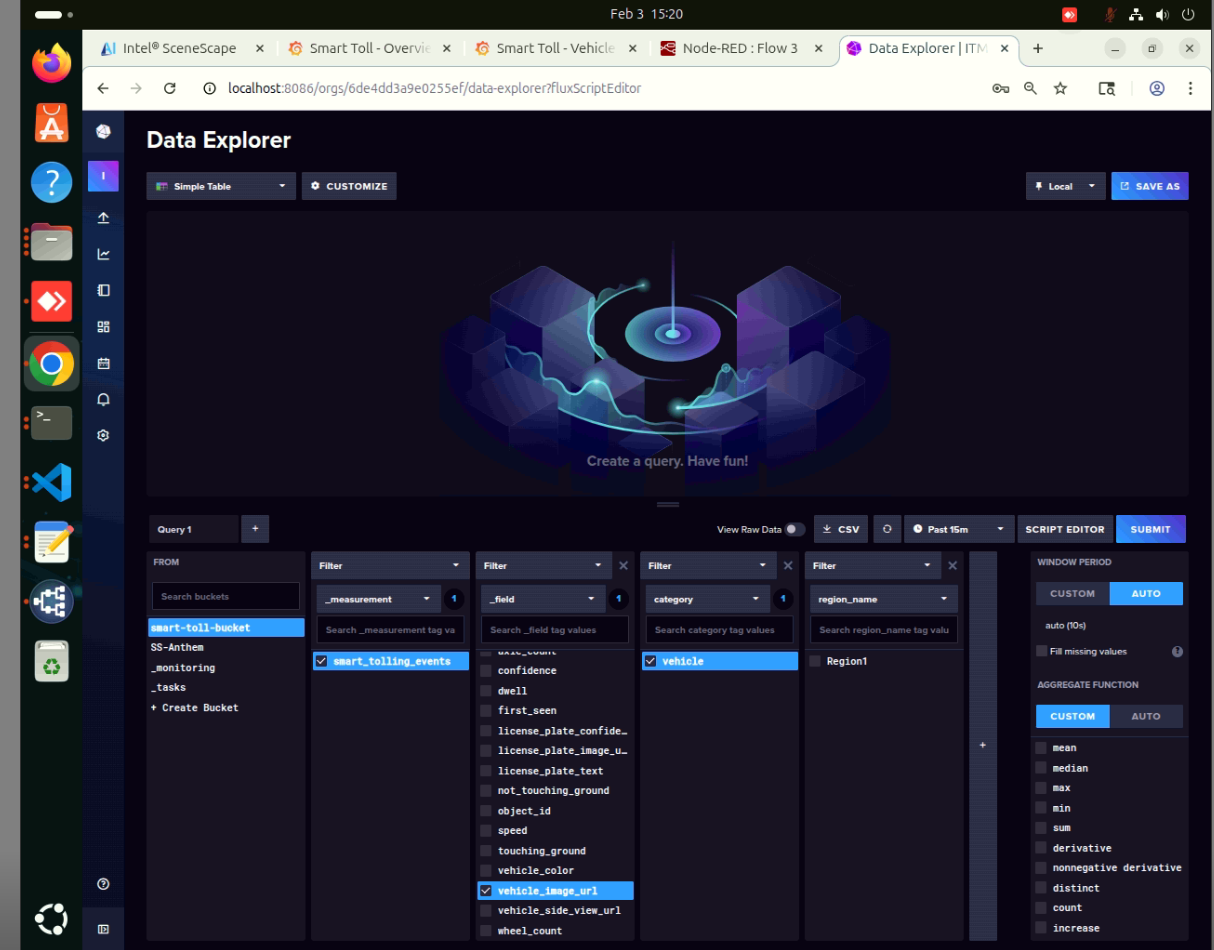
Storage (InfluxDB)#
InfluxDB acts as a single source of truth. All critical and shared data is stored in one location, ensuring every user and system accesses the same, accurate and consistent information.
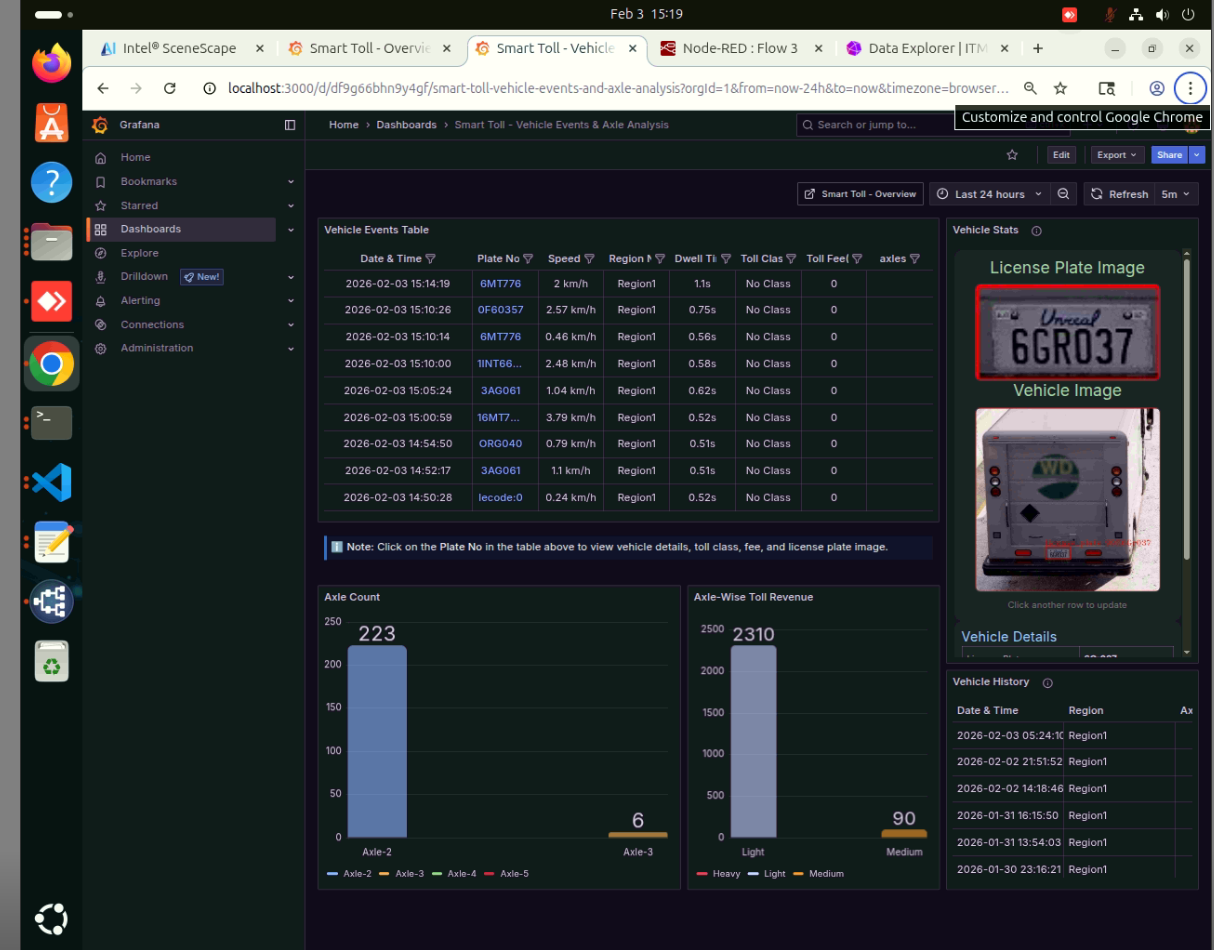
Visualization (Grafana)#
The system ships with a pre-configured dashboard (anthem-intersection.json schema)
focusing on Traffic Volume, Flow Efficiency and Safety Alerts.