Edge Node Host Performance Dashboard#
Using the Edge Node Host Performance Dashboard, you can view the general performance, system information, and track the connectivity and maintenance status of the host.
View Observability and Performance Dashboard#
To view the observability and performance dashboard, perform the following steps:
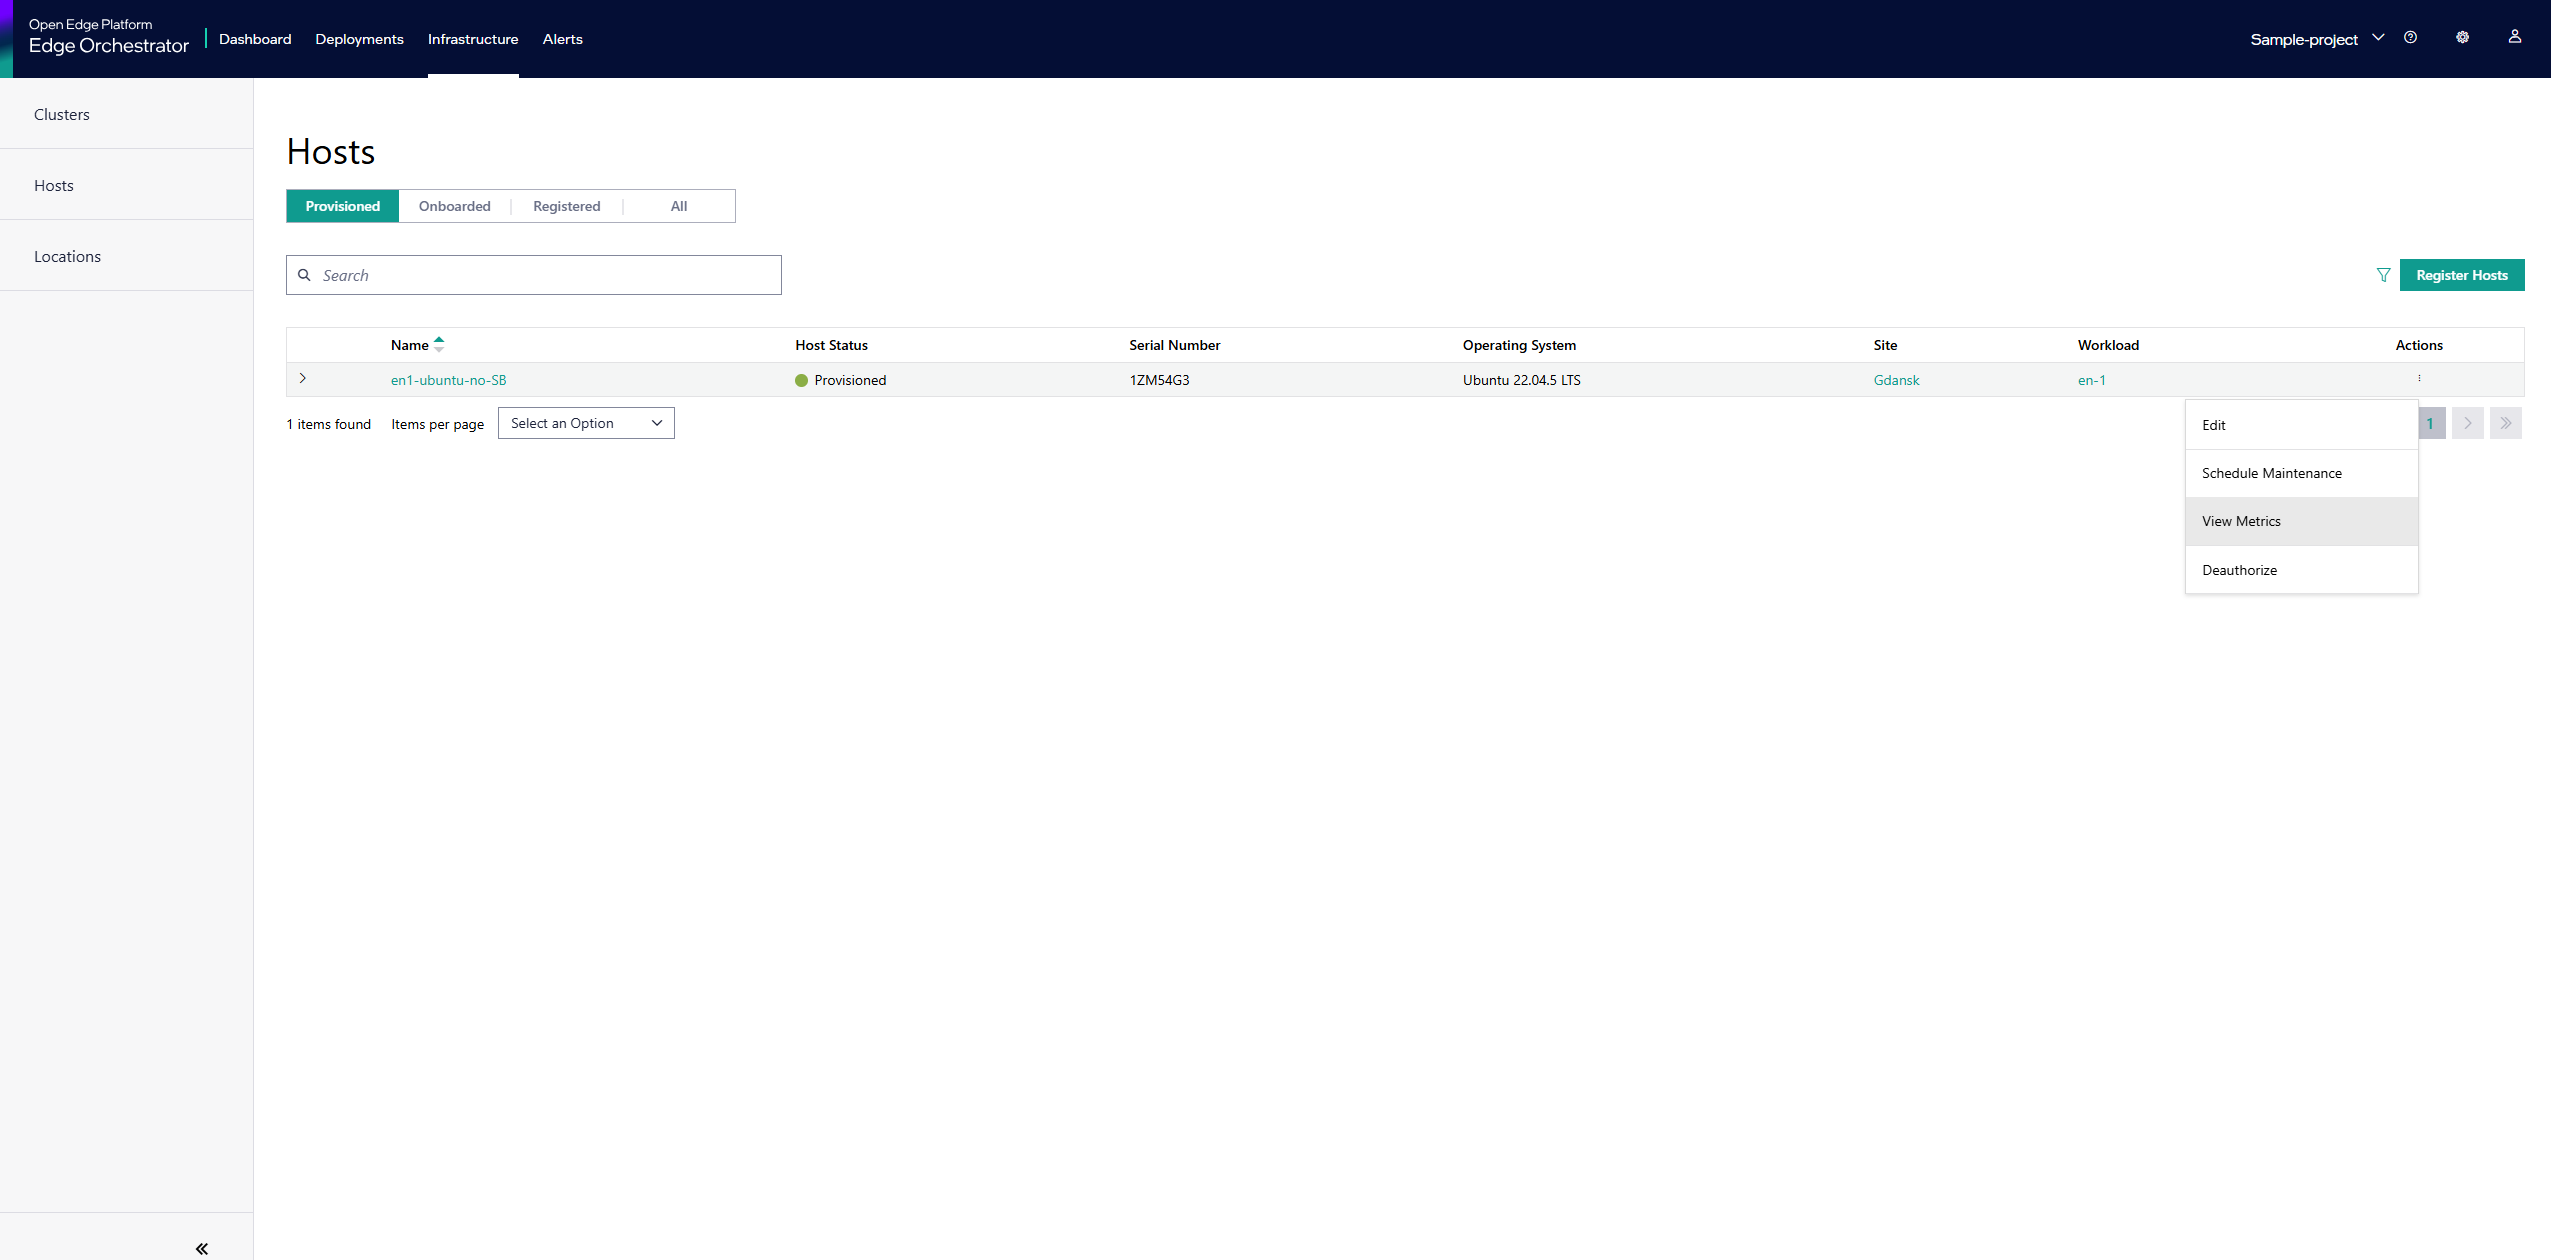
Click Infrastructure on the top menu, then click Provisioned above the hosts list.
Identify the host for which you want to access the metrics for.
Click the three-dot icon in the Actions column and select View Metrics. The Edge Node Host Performance dashboard appears.
The System section shows the metrics for general performance and system information of the host.
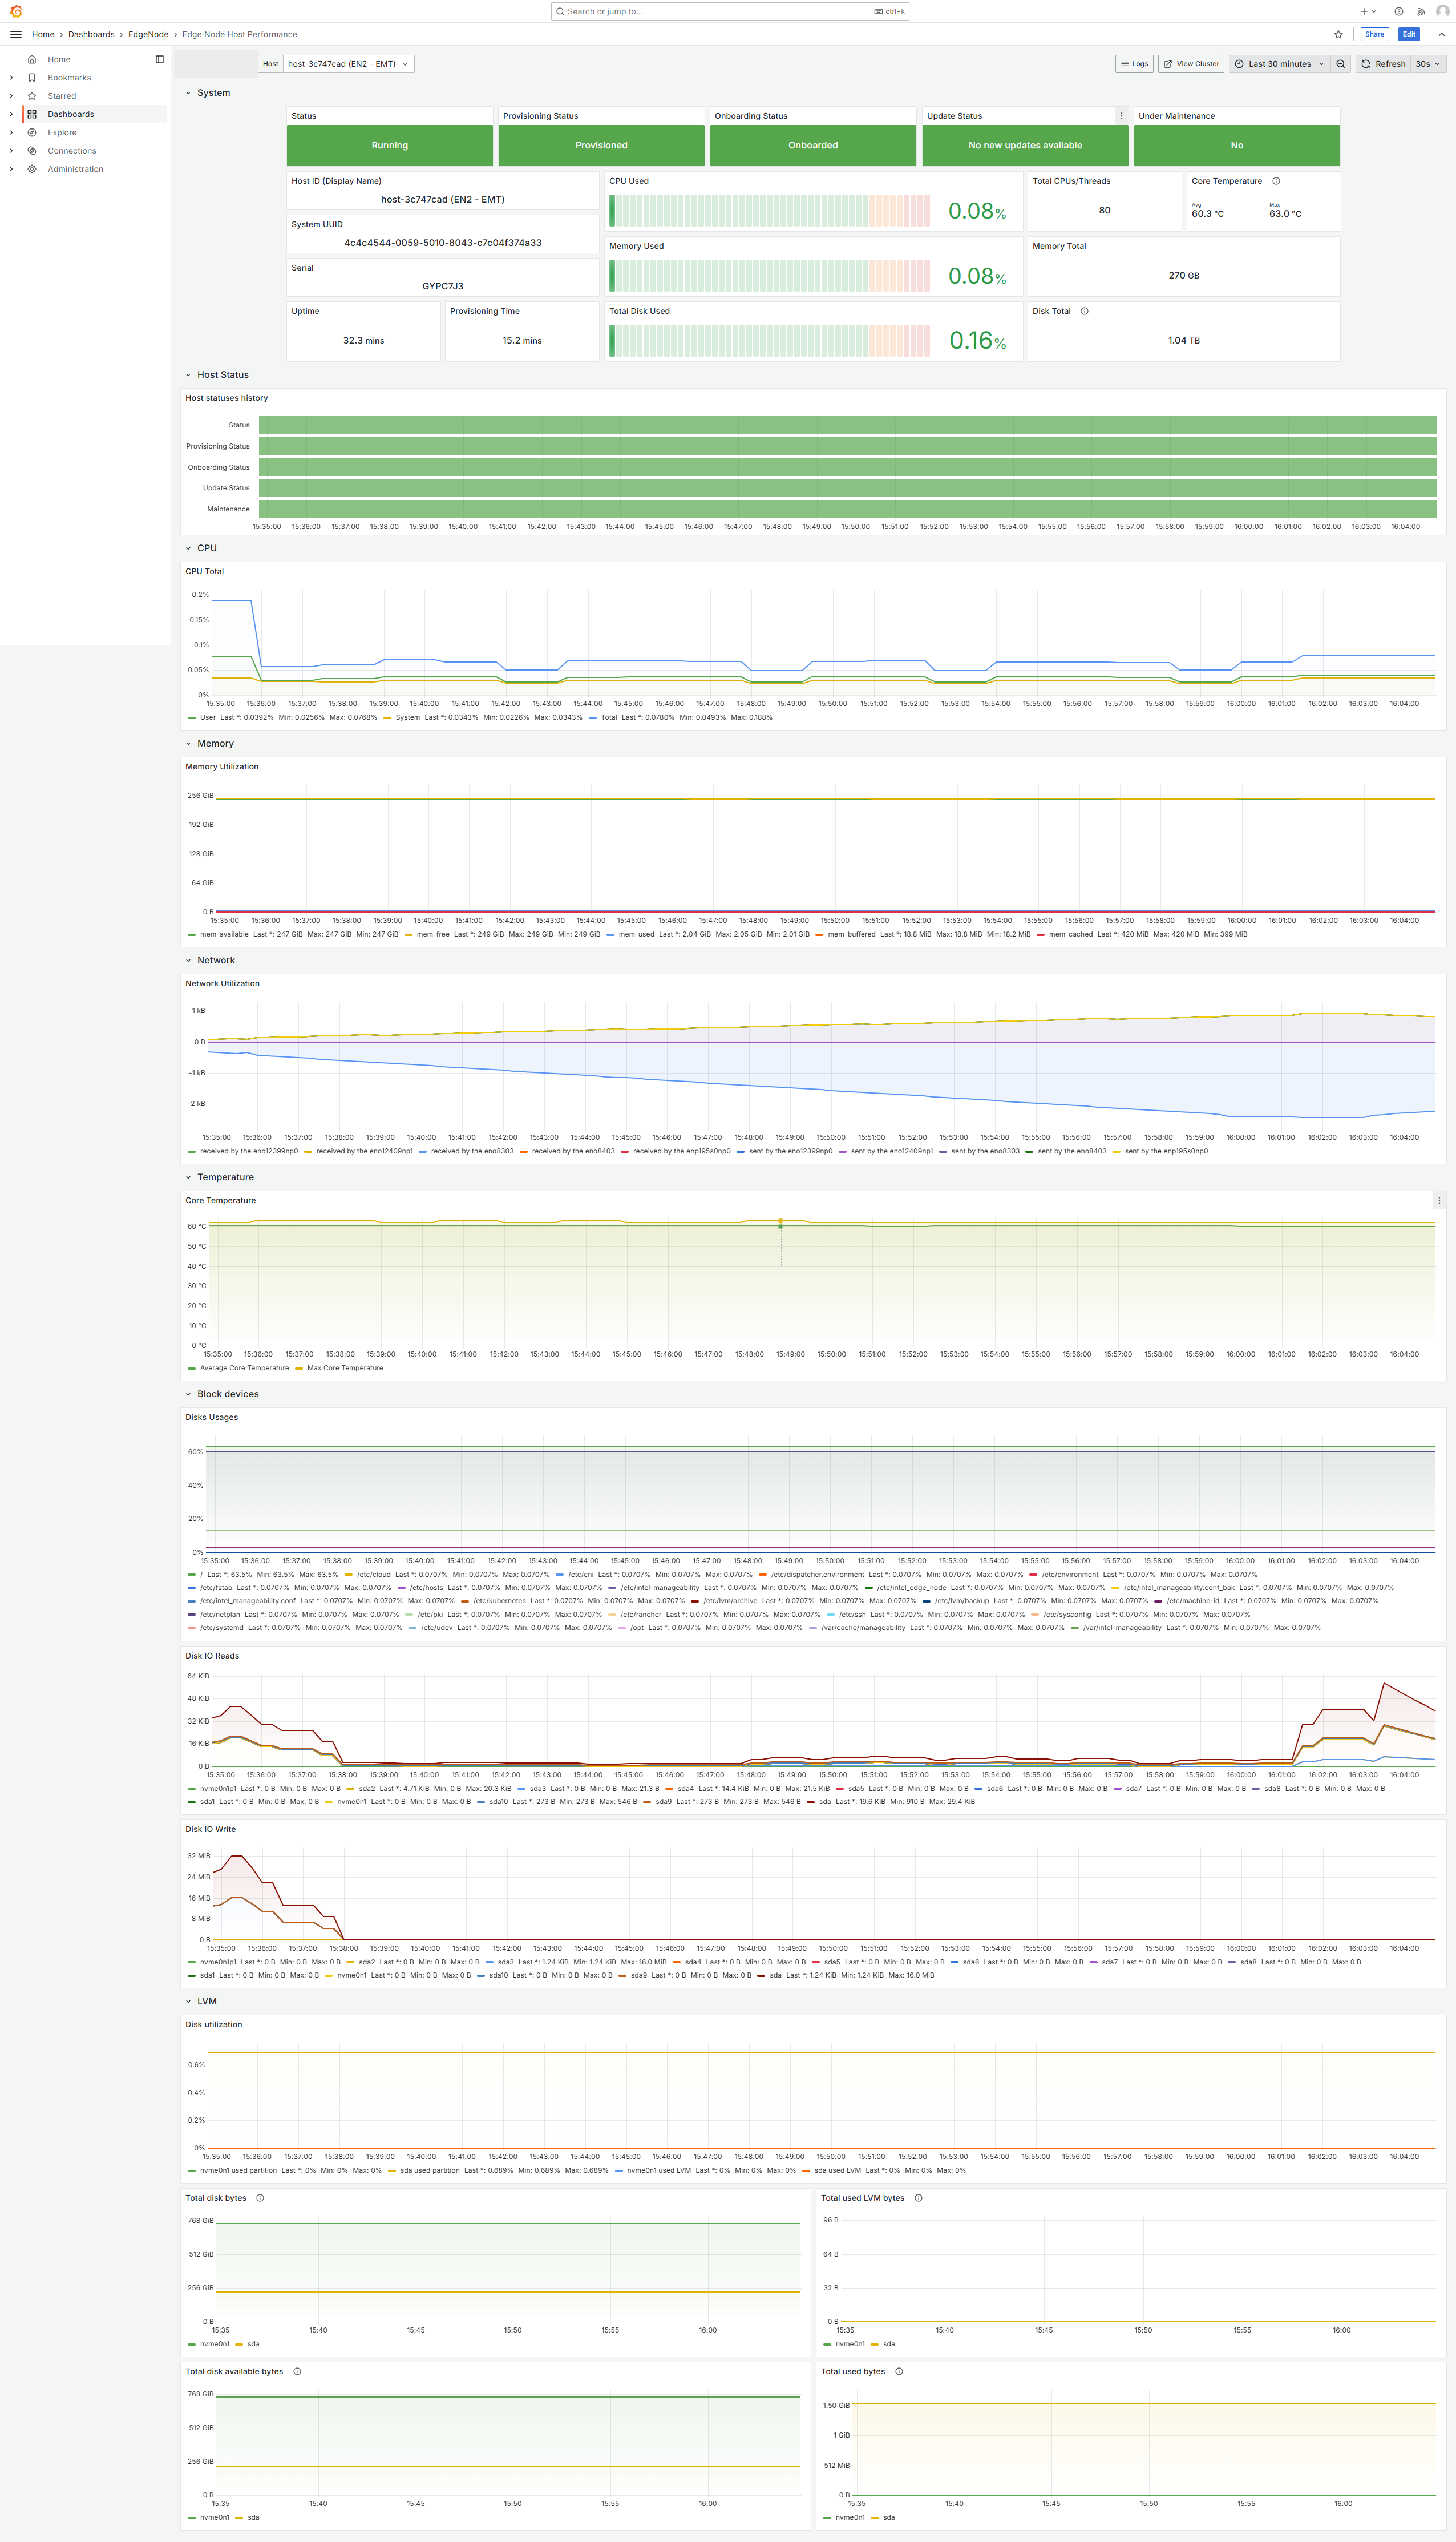
This panel also tracks the current maintenance mode state. This indicates if the host is undergoing a planned outage such as a maintenance window, or undergoing an upgrade.
You can also track the connectivity status of the host by using the Host Status panel.

This panel shows the current and historical status of the host.
View Host Logs#
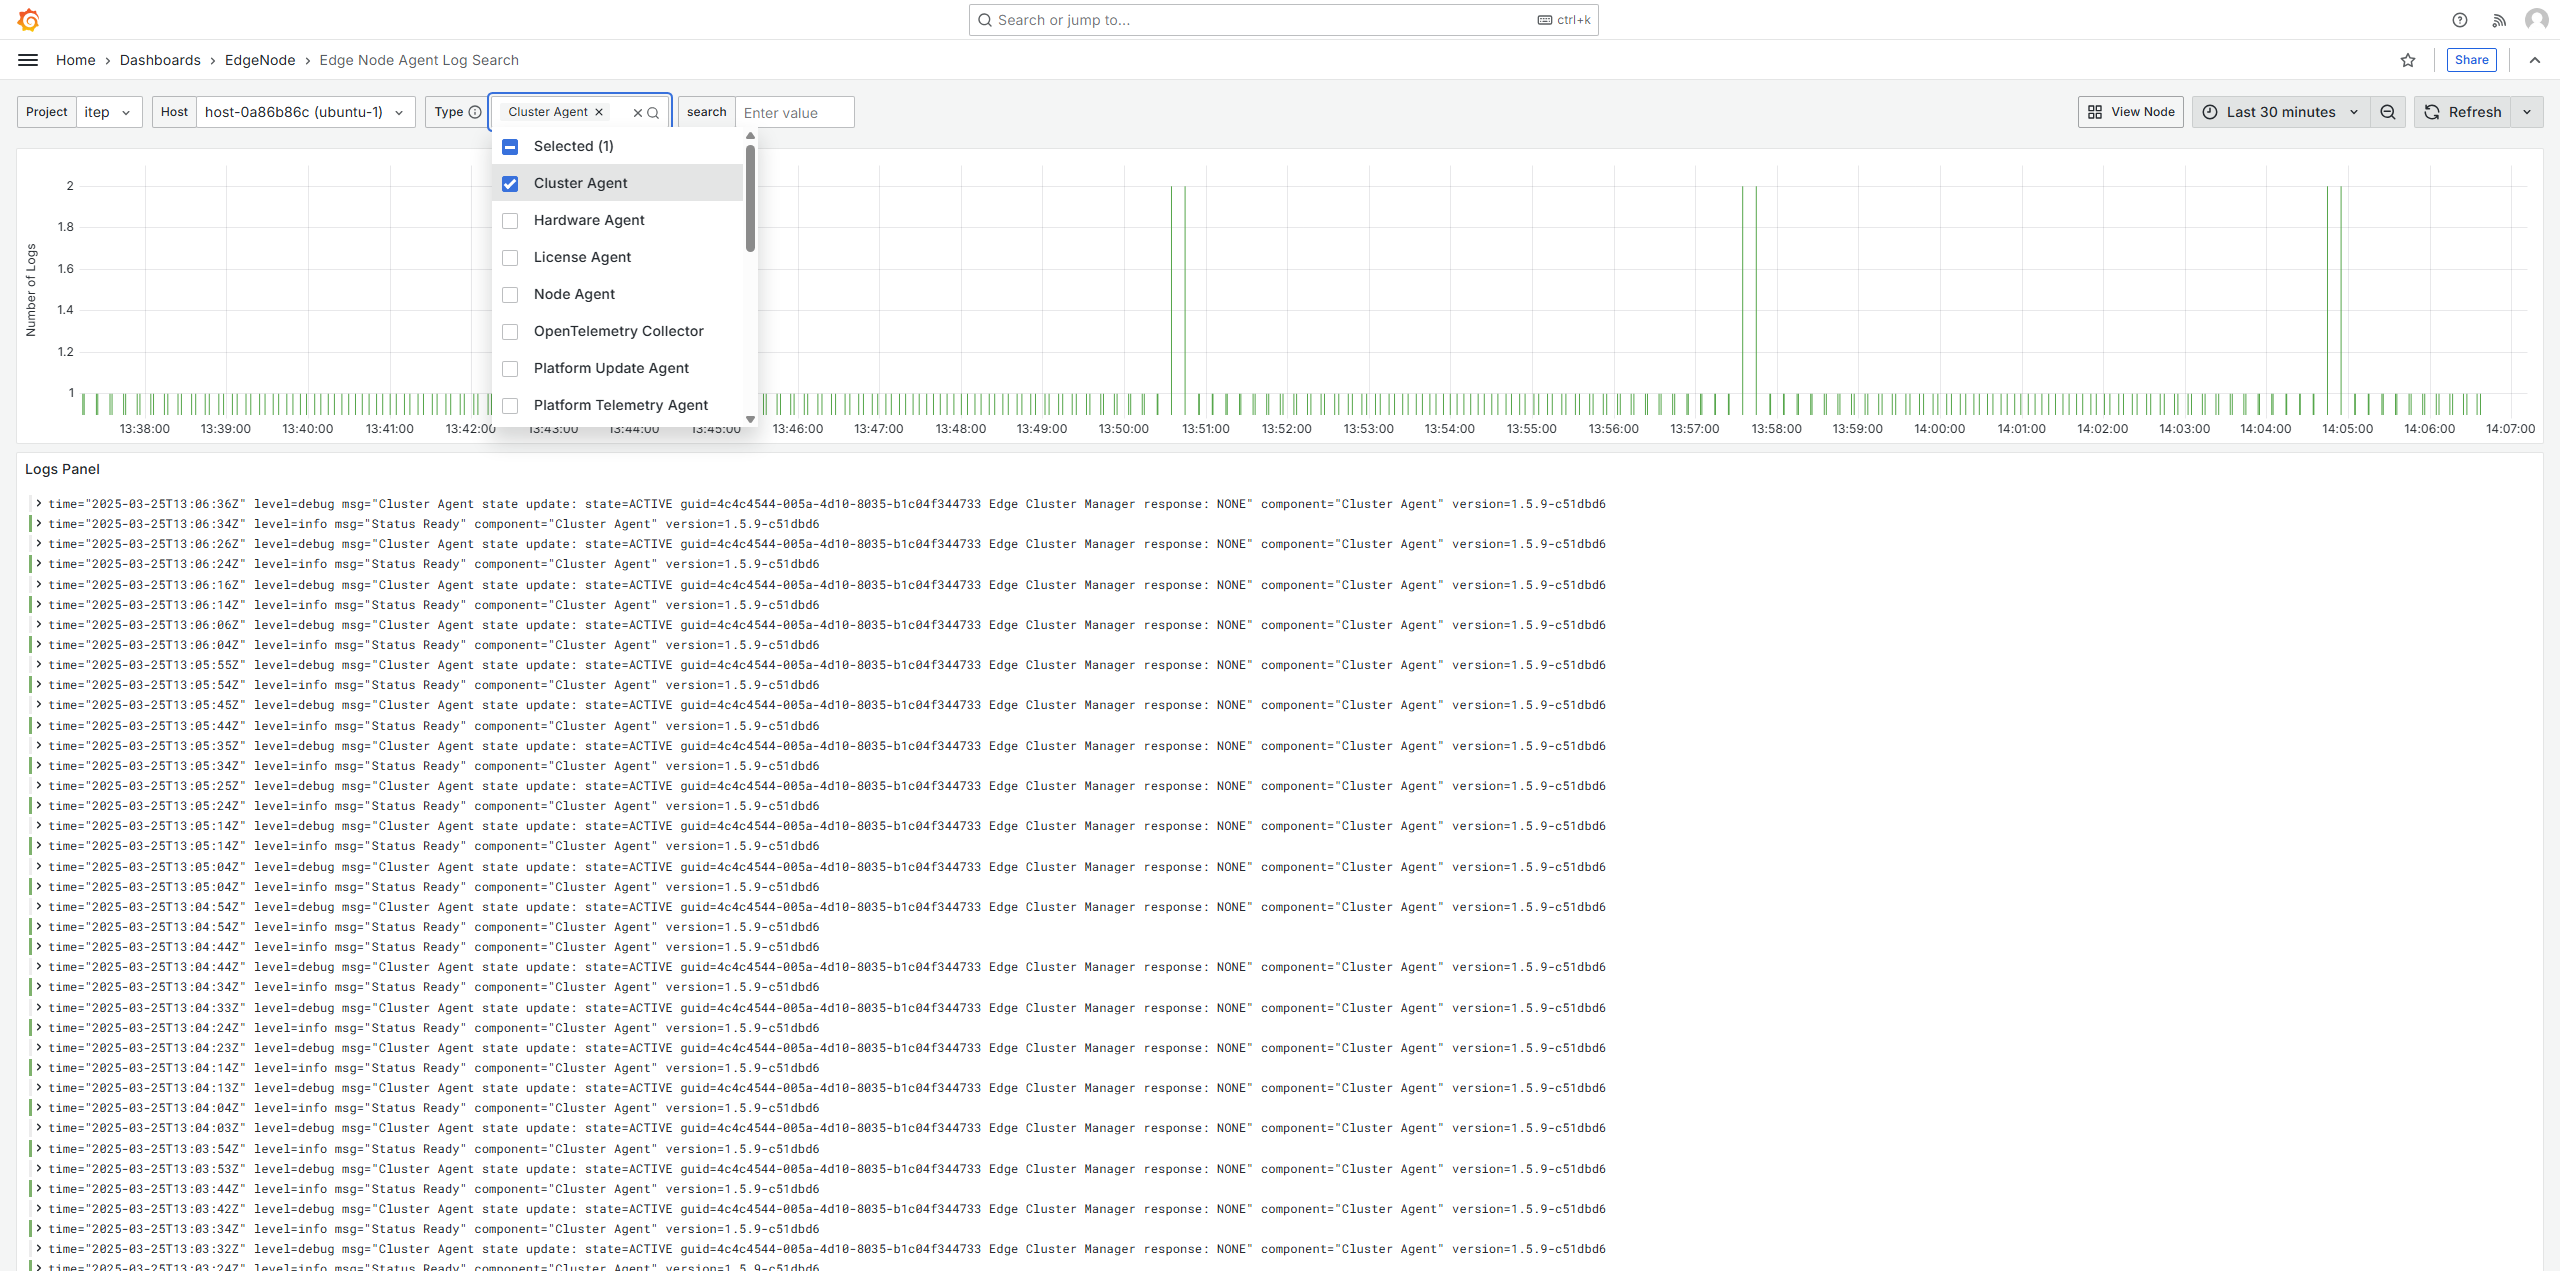
From the Edge Node Host Performance dashboard, you can navigate to the Logs dashboard for the Edge Node by clicking the Logs button in the top right of the dashboard. This will reveal a drop-down menu of available logs to view.
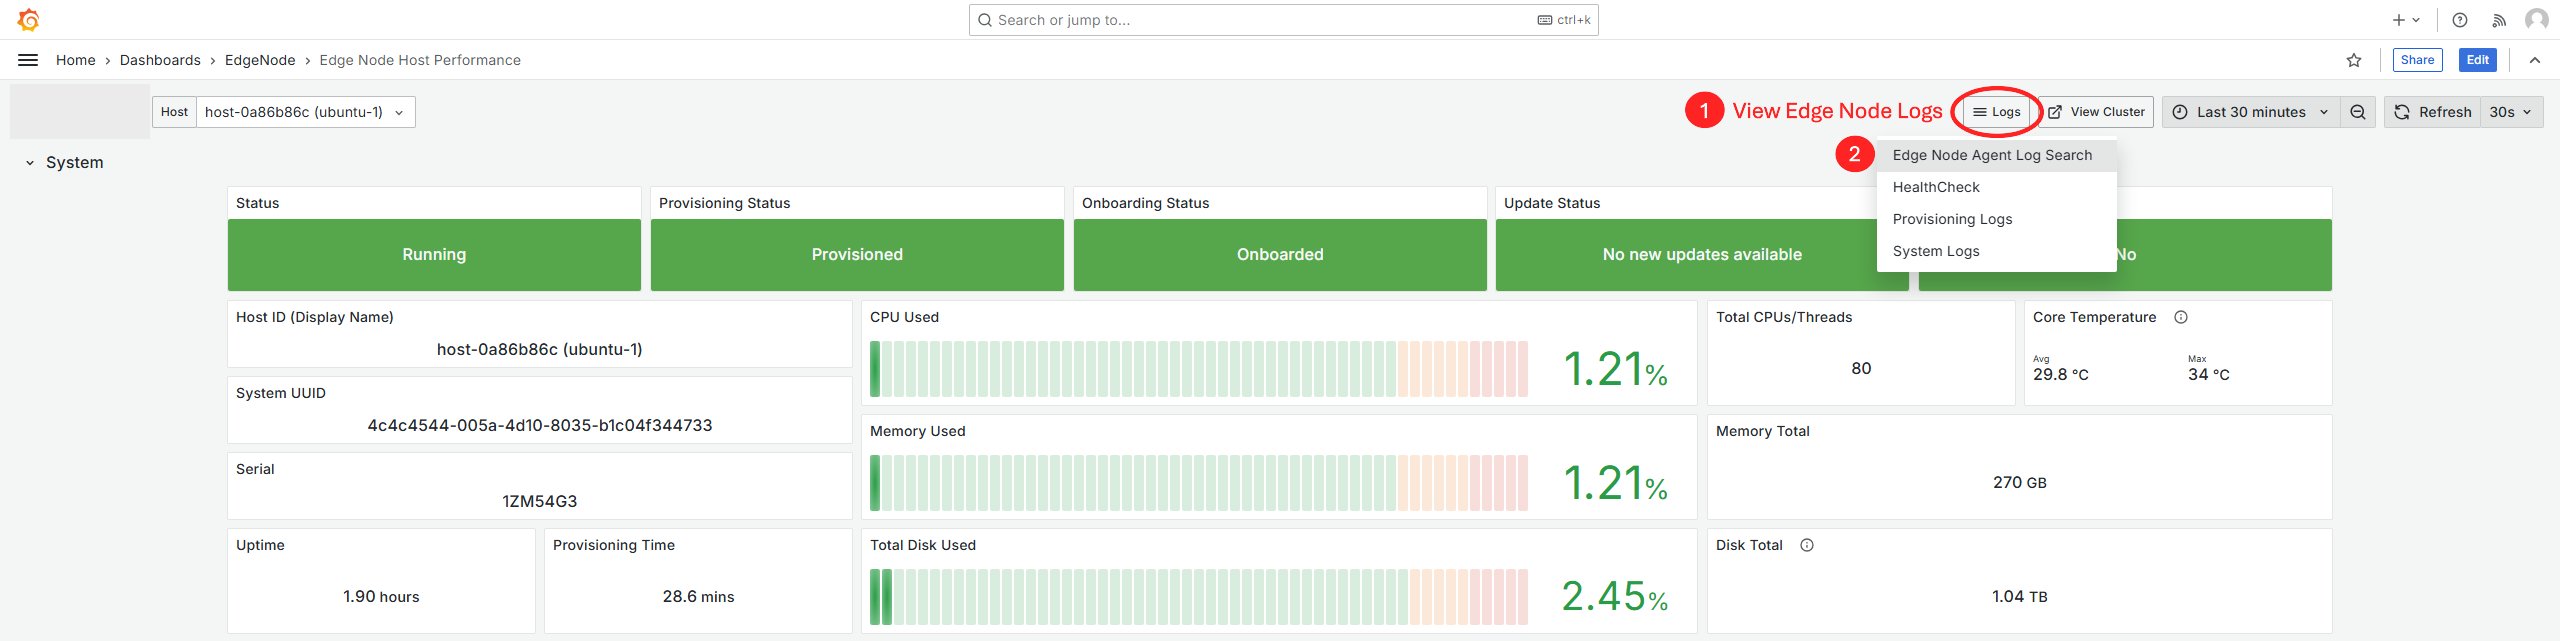
Edge Node Agent Logs
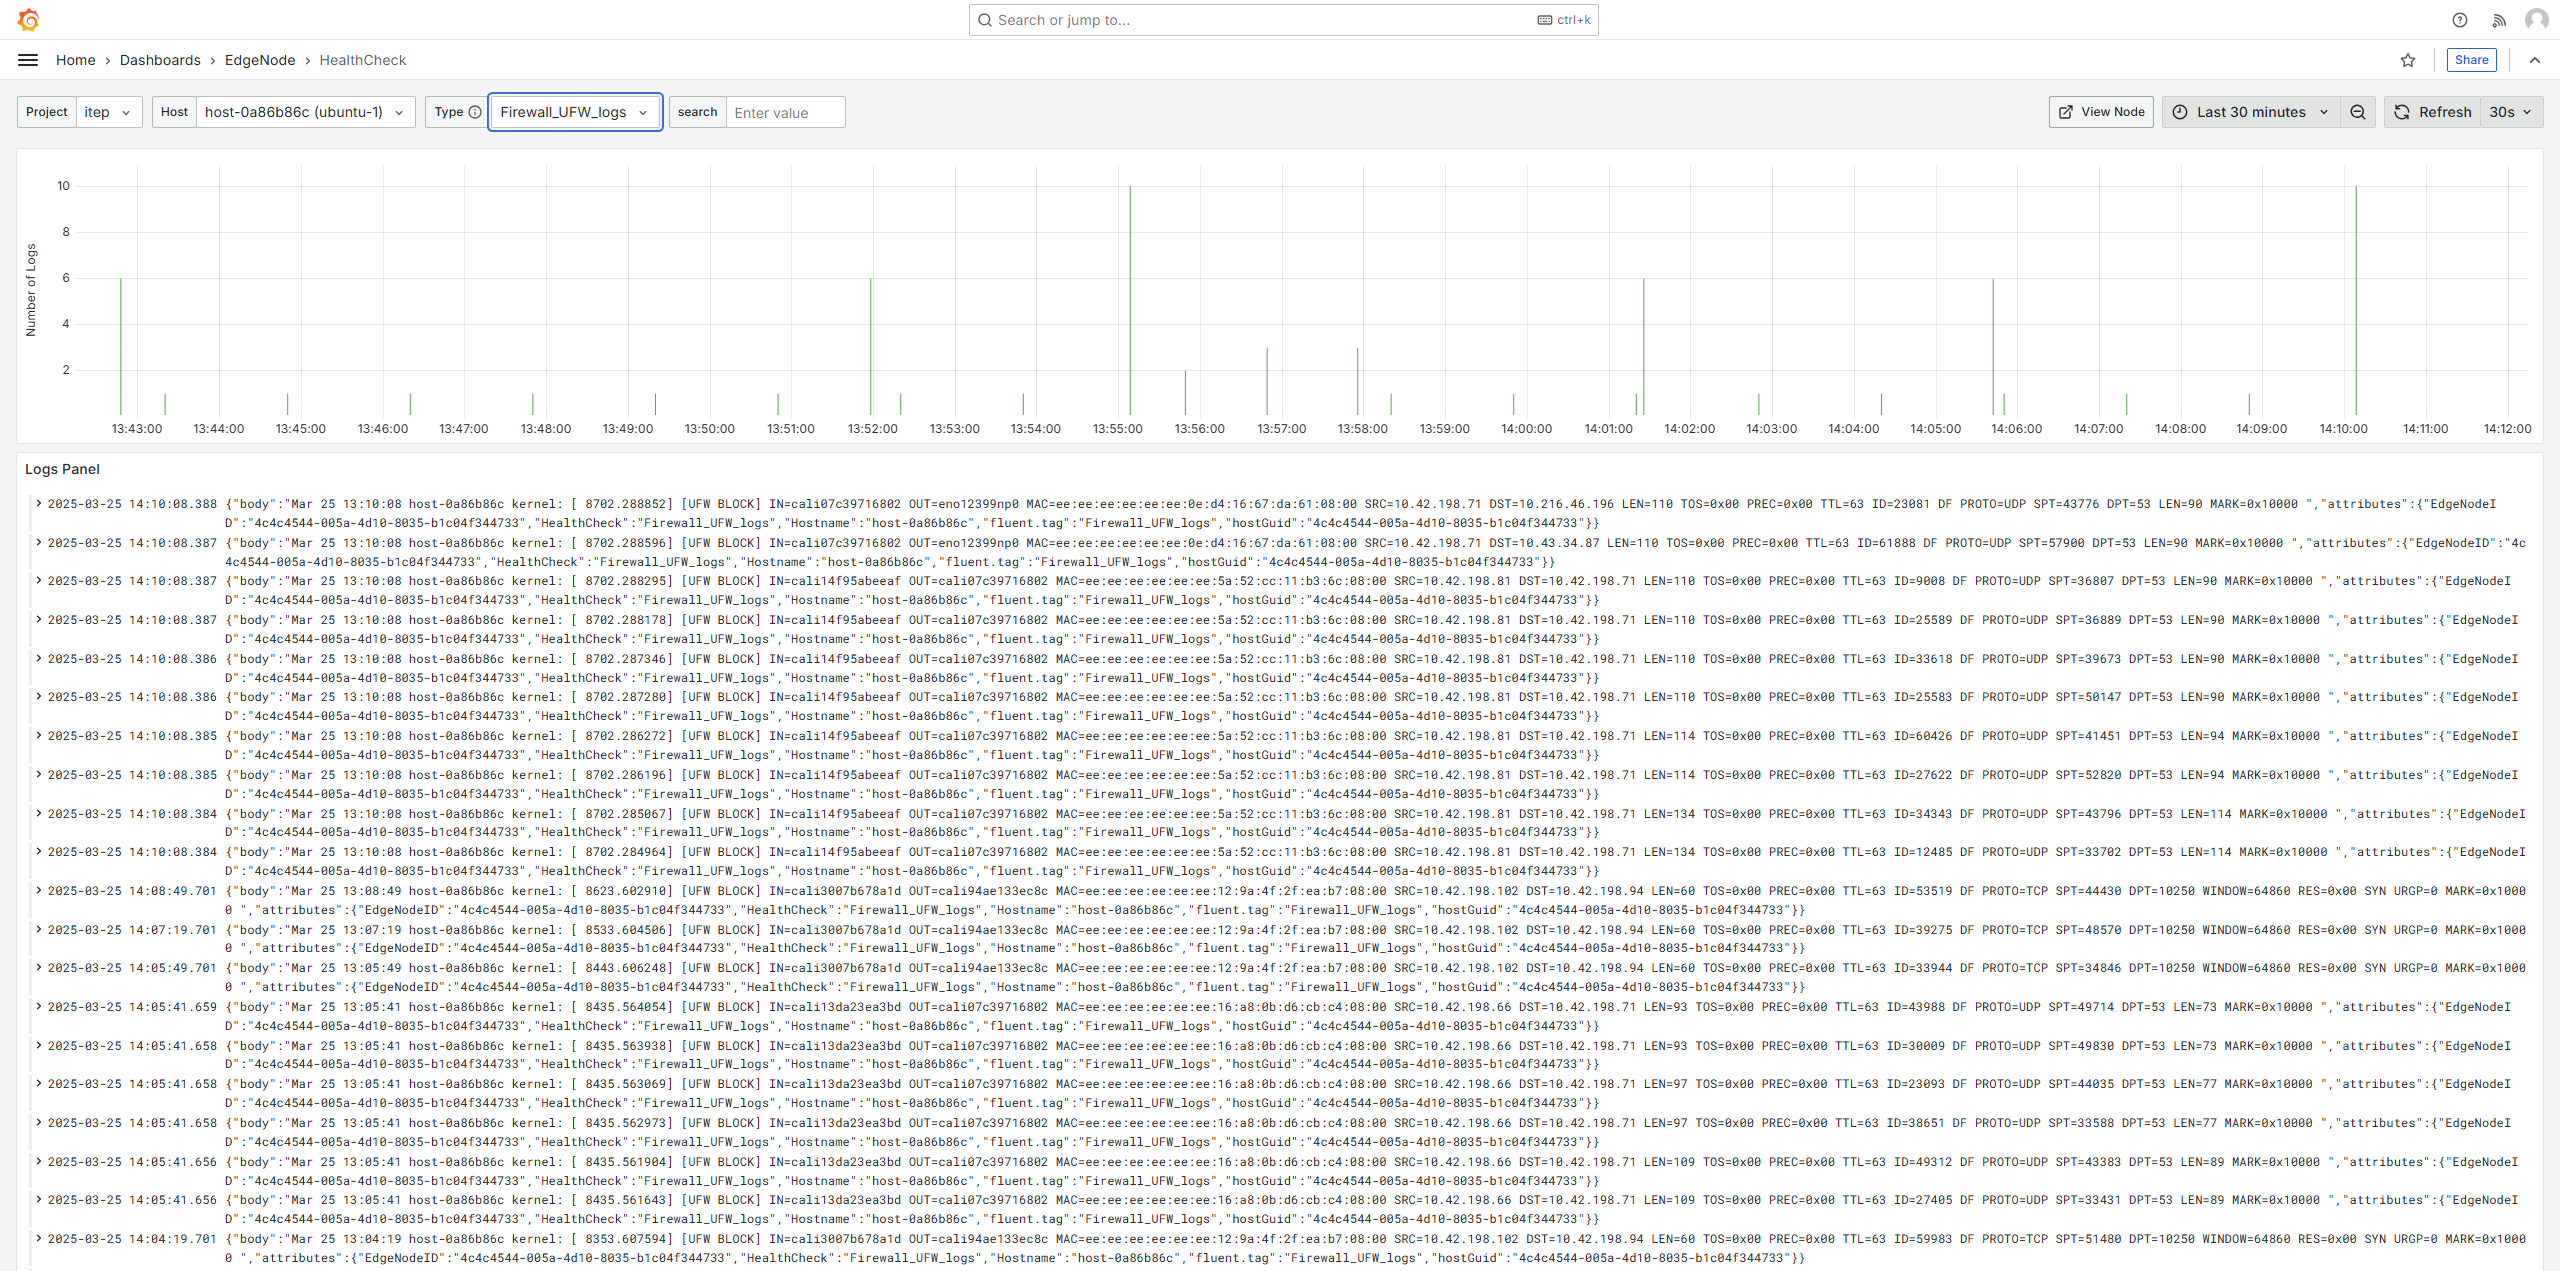
Edge Node Health Check Logs