Benchtool#
This tutorial will show you how to use Benchtool to measure the frequency of messages published in selected ROS 2 topics.
When to use it over ros2 topic hz?#
Use Benchtool when:
You want to measure the publishing frequency of multiple topics at once.
You want to save the results to a file for later analysis (csv).
You want temporally accurate data.
You want to measure topics that produce a high volume of data (above 1-2 GB/s
ros2 topic hzstats produce highly unreliable data).You want to measure the publishing frequency of specific transformations (TFs).
Use ros2 topic hz when:
You want to measure arbitrary topics quickly. (Due to technical limitations this tool is not capable of recording arbitrary topics, and support for them needs to be included in the source code. On the bright size this is easily extendable and requires 3 lines of code to add a new topic type.)
Installation#
sudo apt install ros-humble-benchtool
# (optionally) install also a bag for purpose of demonstration
sudo apt install ros-humble-bagfile-2d-lidar
Configuration#
First, you need to set up benchtool.toml file, below is an example of a configuration file.
You can configure it to suit your needs.
[main]
video_topics = ["/camera/color/image_raw", "/camera/aligned_depth_to_color/image_raw"]
tf_child_frames = ["camera"]
This list provides the names of the topics and the corresponding ROS message types that are used in the Benchtool.
Video Topics - Message Type: sensor_msgs::msg::Image - Name: video_topics
Map Topics - Message Type: nav_msgs::msg::OccupancyGrid - Name: map_topics
TF Child Frames - Message Type: tf2_msgs::msg::TFMessage - Name: tf_child_frames
Markers Topics - Message Type: visualization_msgs::msg::MarkerArray - Name: markers_topics
Path Topics - Message Type: nav_msgs::msg::Path - Name: path_topics
Point Cloud2 Topics - Message Type: sensor_msgs::msg::PointCloud2 - Name: point_cloud2_topics
This tool also supports subscriptions to arbitrary topic types, to do this you need to create array of tables called generics in config toml file. Bellow is a file that has the same behavior as above but uses [[generics]] syntax. [[generics]] section can appear any number of times, https://toml.io/en/v1.0.0#array-of-tables
[main]
tf_child_frames = ["camera"]

[[generics]]
type = "sensor_msgs/msg/Image"
topics = ["/camera/color/image_raw","/camera/aligned_depth_to_color/image_raw"]
Usage#
To start the Benchtool, run the following command:
ros2 run benchtool benchtool --ros-args -p toml:=./benchtool.toml -p o_csv:=./results.csv
This will start the Benchtool with the configuration file benchtool.toml and save the results to results.csv.
Advanced usage - Prometheus Server + Grafana Dashboard#
This tool by default will also create a Prometheus Server. In this section you will learn how to use the Benchtool with Prometheus Server and Grafana Dashboard to visualize the data.
First, you need to install Docker Engine through https://docs.docker.com/engine/install/.
Then you need to prepare config file for Prometheus Server. Save it in /home/$USER/prometheus.yml.
global:
  scrape_interval: 15s
  scrape_timeout: 10s
  scrape_protocols:
  - OpenMetricsText1.0.0
  - OpenMetricsText0.0.1
  - PrometheusText0.0.4
  evaluation_interval: 15s
alerting:
  alertmanagers:
  - follow_redirects: true
    enable_http2: true
    scheme: http
    timeout: 10s
    api_version: v2
    static_configs:
    - targets: []
scrape_configs:
- job_name: prometheus
  honor_timestamps: true
  track_timestamps_staleness: false
  scrape_interval: 15s
  scrape_timeout: 10s
  scrape_protocols:
  - OpenMetricsText1.0.0
  - OpenMetricsText0.0.1
  - PrometheusText0.0.4
  metrics_path: /metrics
  scheme: http
  enable_compression: true
  follow_redirects: true
  enable_http2: true
  static_configs:
  - targets:
    - localhost:9090
    - localhost:8080 # This is the port where Benchtool will be running
Now let’s start the Benchtool with Prometheus Server and Grafana Dashboard.
docker run -d --name prometheus -p 9090:9090 --network=host -v /home/$USER/prometheus.yml:/etc/prometheus/prometheus.yml prom/prometheus
docker run -d -p 3000:3000 --network=host grafana/grafana-enterprise
ros2 run benchtool benchtool --ros-args -p toml:=./benchtool.toml -p o_csv:=./results.csv
Now you can access Grafana Dashboard at http://localhost:3000 , Prometheus Server at http://localhost:9090 and Benchtool at http://localhost:8080/metrics
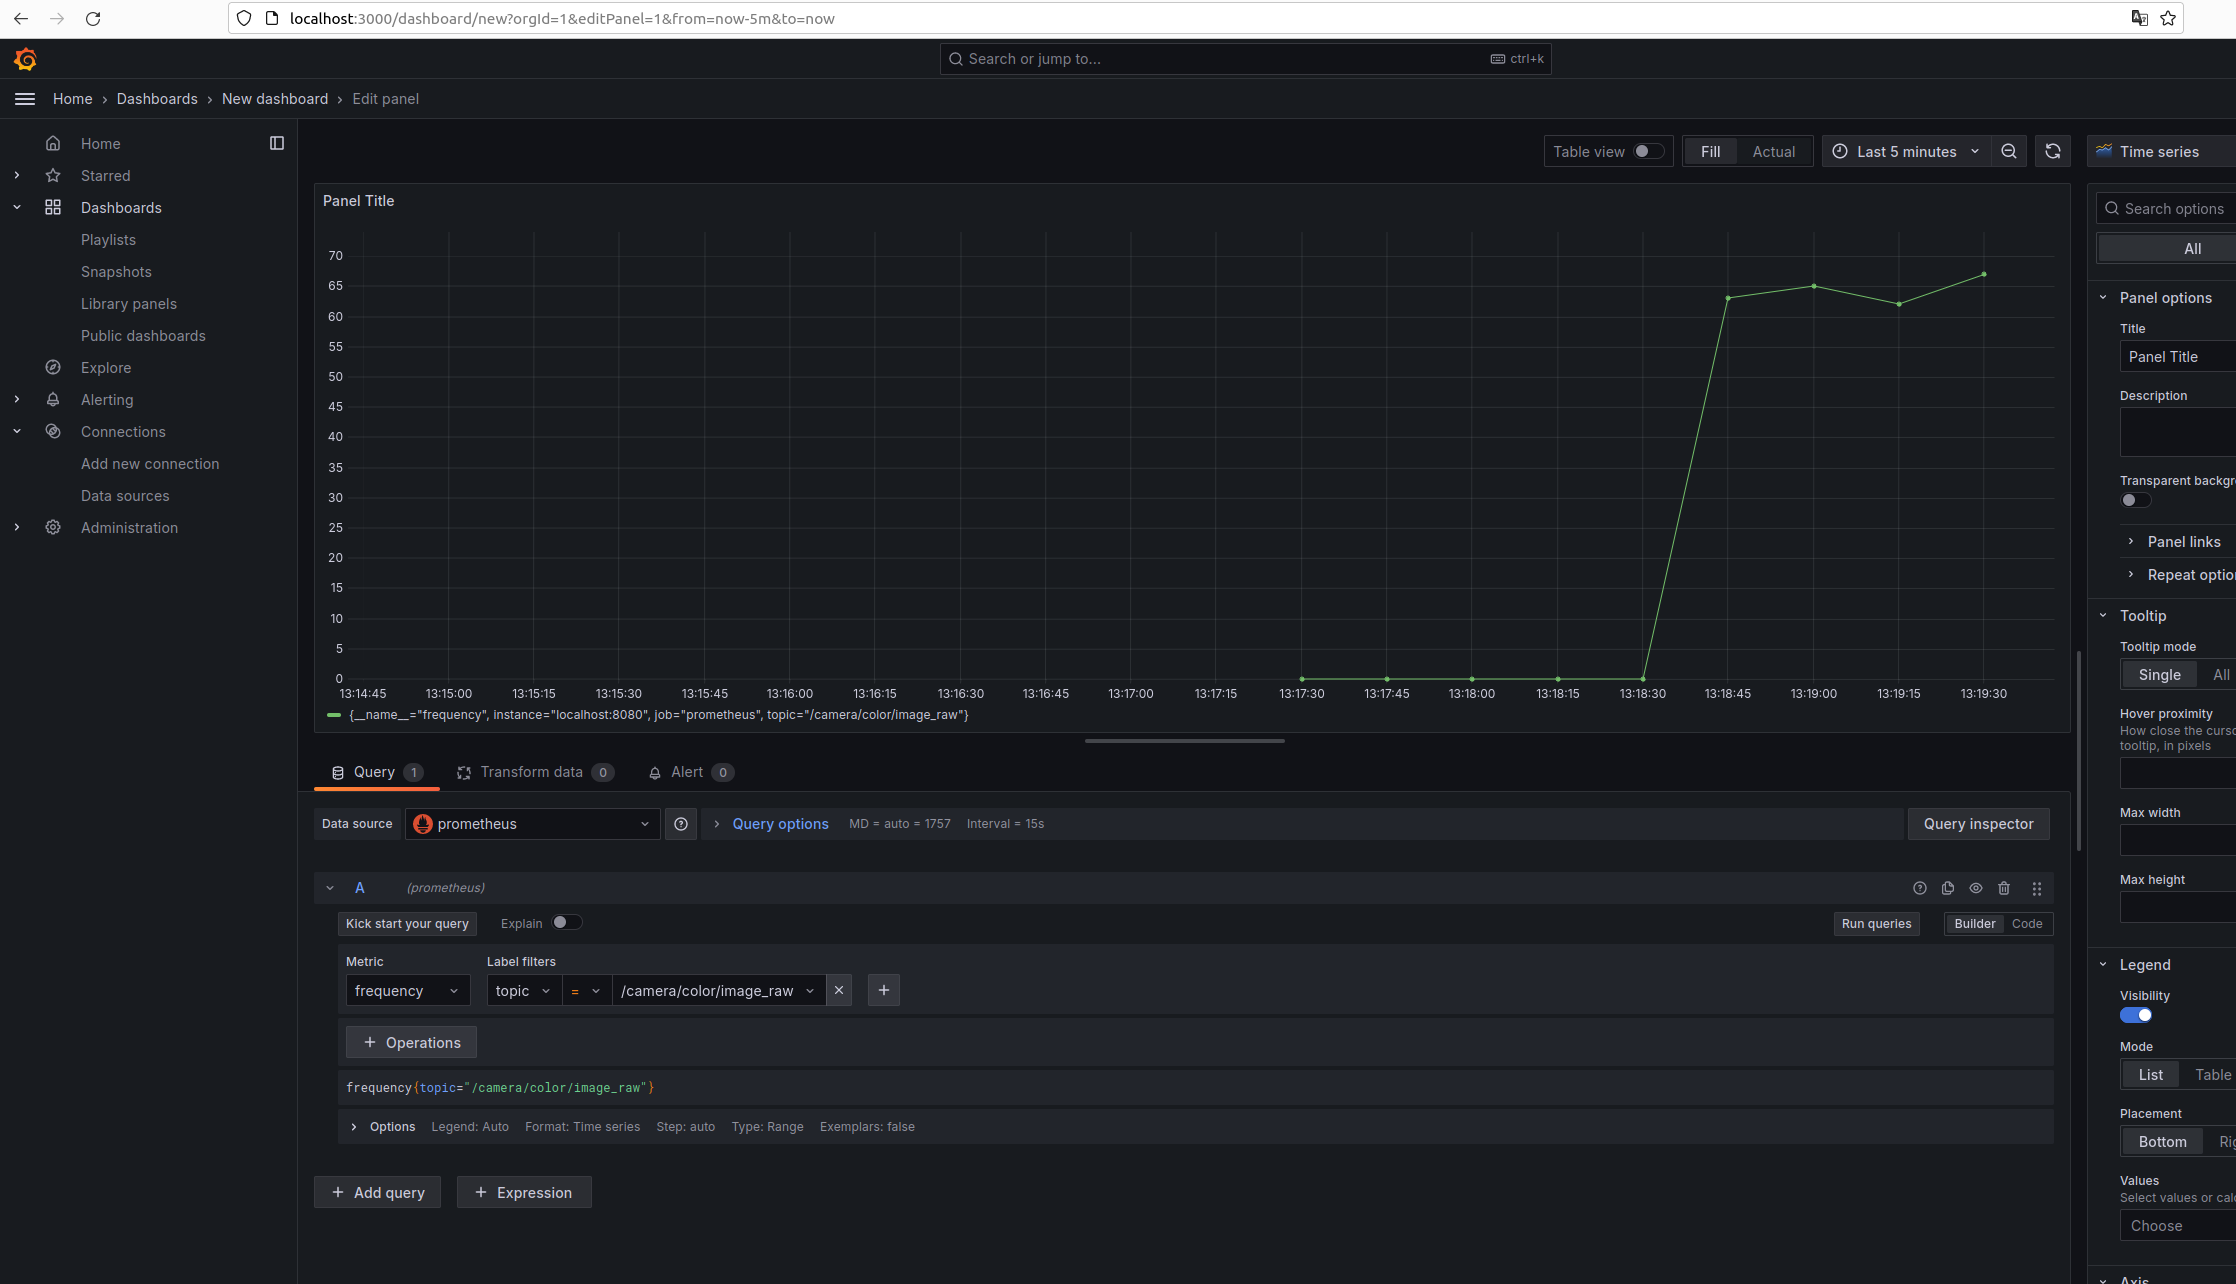
After you open Grafana Dashboard you need to login with default credentials (admin:admin) and add Prometheus Server (localhost:9090) as a data source. Then you can create a new dashboard and add a new graph. In the query editor you can select the data source and the metric you want to visualize. Right now Benchtool supports the following metrics:
frequency with labels topic and type (e.g. frequency{topic=”/camera/color/image_raw”, type=”sensor_msgs/msg/Image”})
total_messages with labels topic and type (e.g. total_messages{topic=”/camera/color/image_raw”, type=”sensor_msgs/msg/Image”})
Image of the Grafana Dashboard: