Analytics Pipeline (Downstream)#
Raw metadata is valuable, but actionable insights come from the Analytics Pipeline.
Node-RED Transformation#
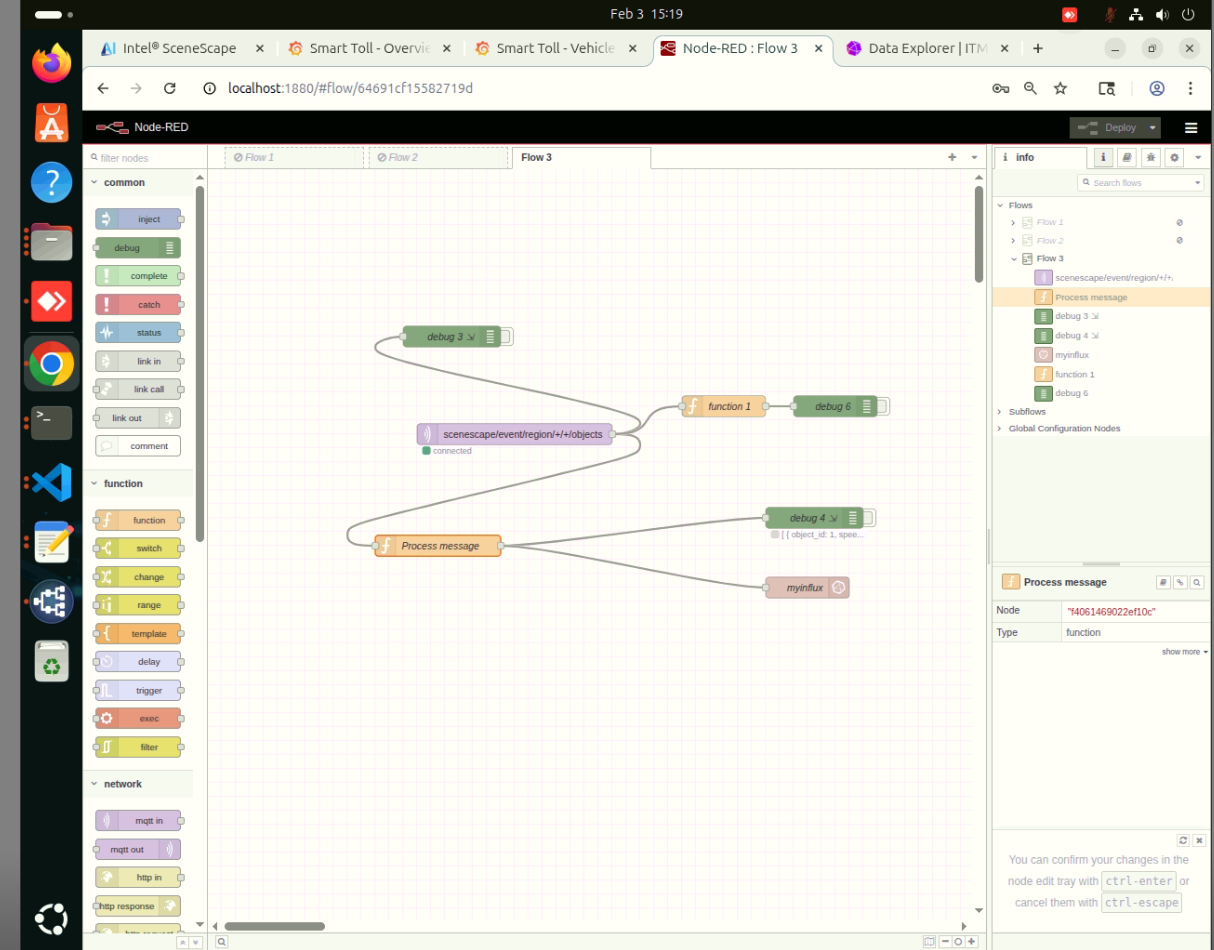
Input: The MQTT IN Node subscribes to
scenescape/event/region/+/+/objects.Logic: The Function node tags each exited vehicle with its region, computes speed from velocity, and passes through the dwell time already calculated by Scenescape.
Output: The InfluxDB OUT Node writes the tagged records to InfluxDB, where Grafana queries aggregate them into counts and flow metrics.
Storage (InfluxDB)#
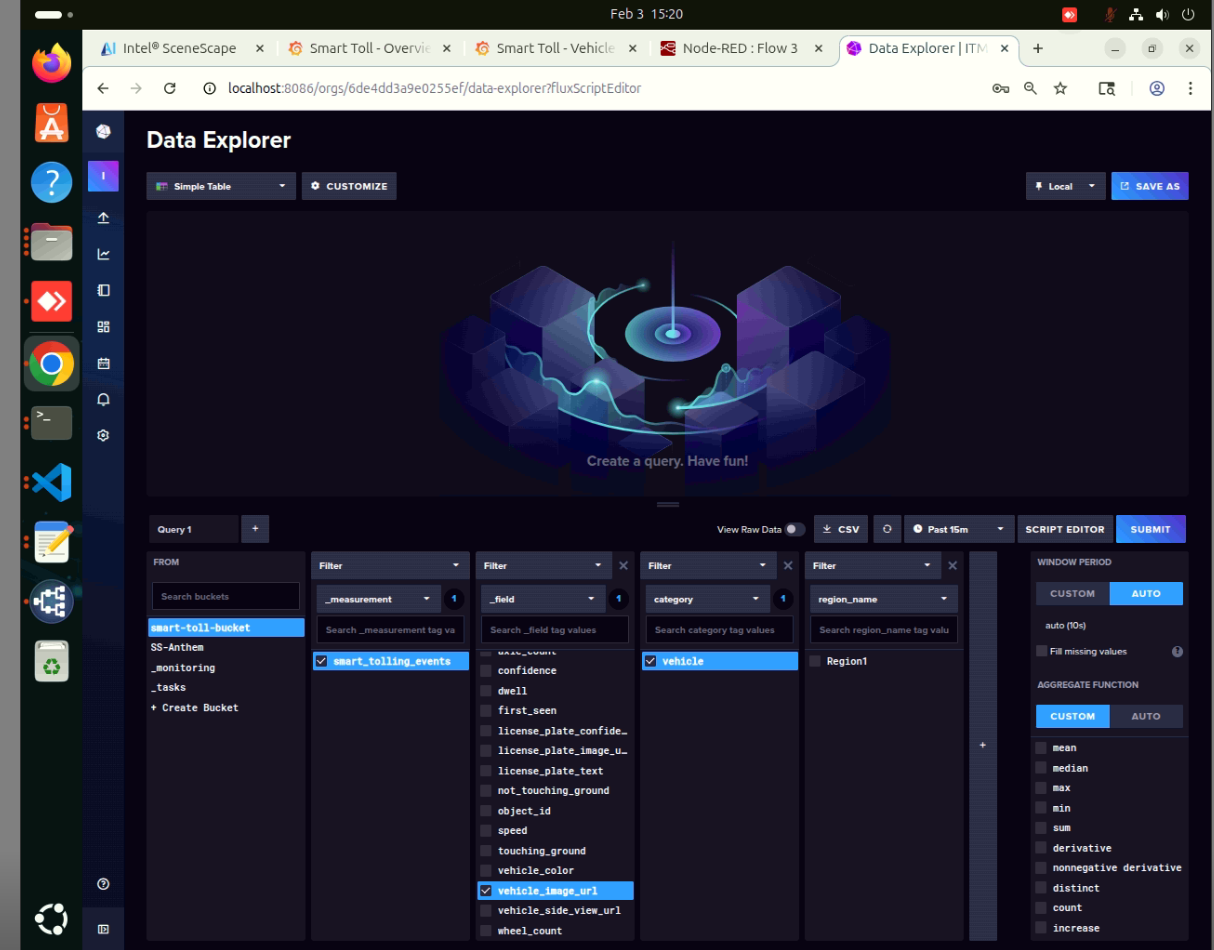
InfluxDB stores the tagged vehicle-exit records as a time series for Grafana to query.
Visualization (Grafana)#
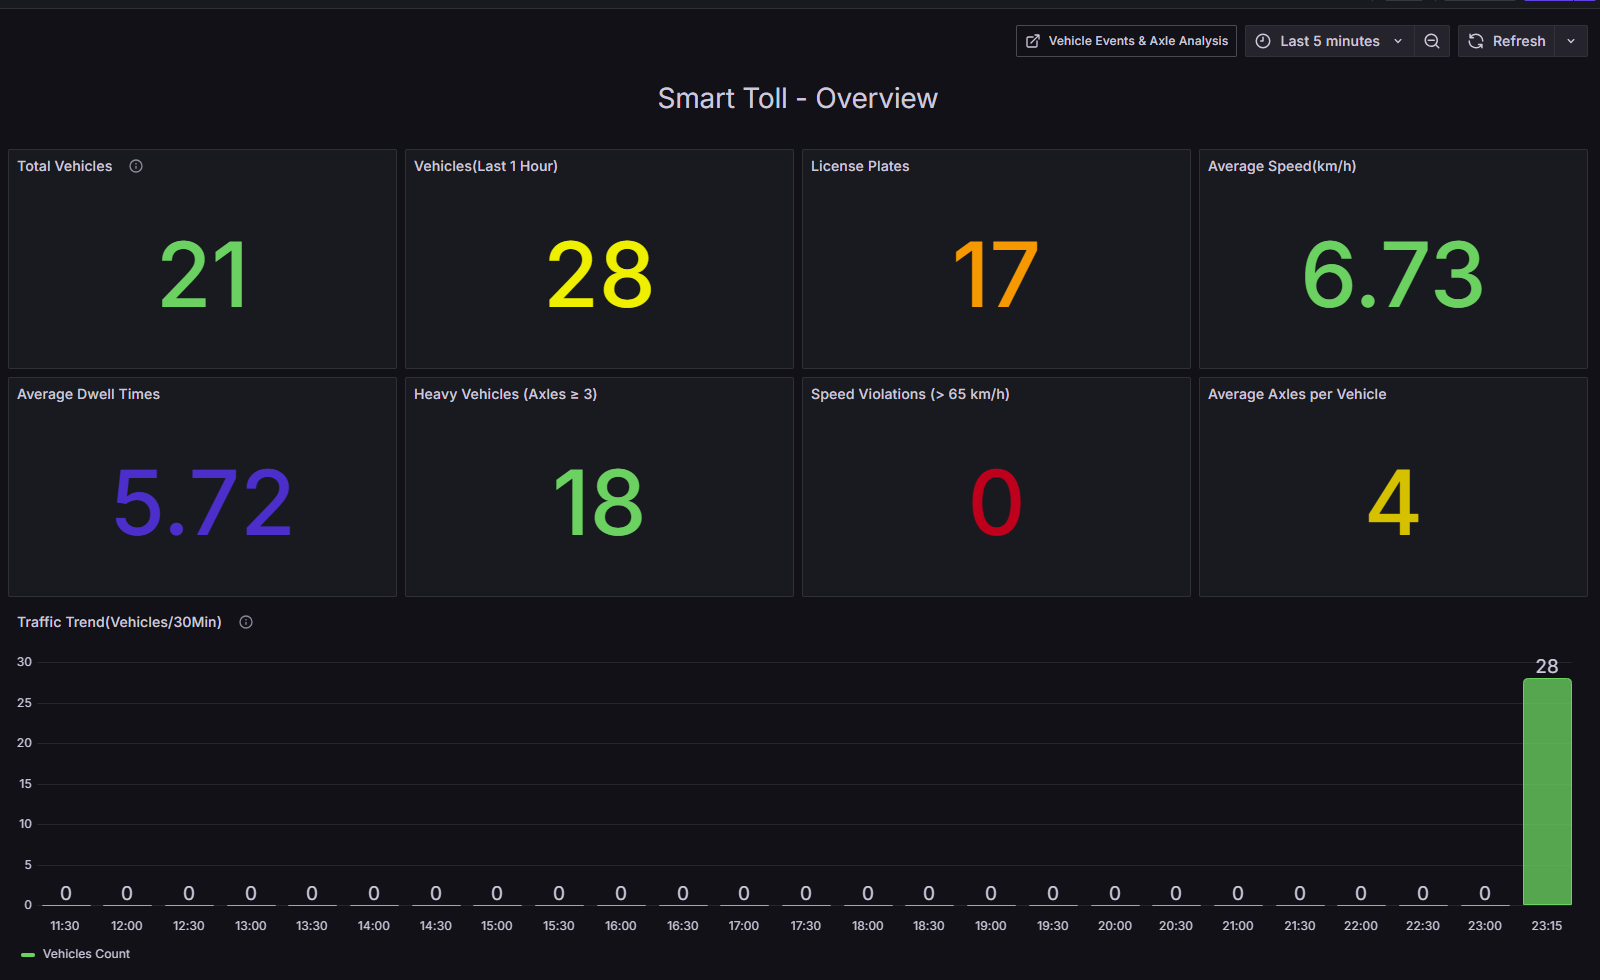
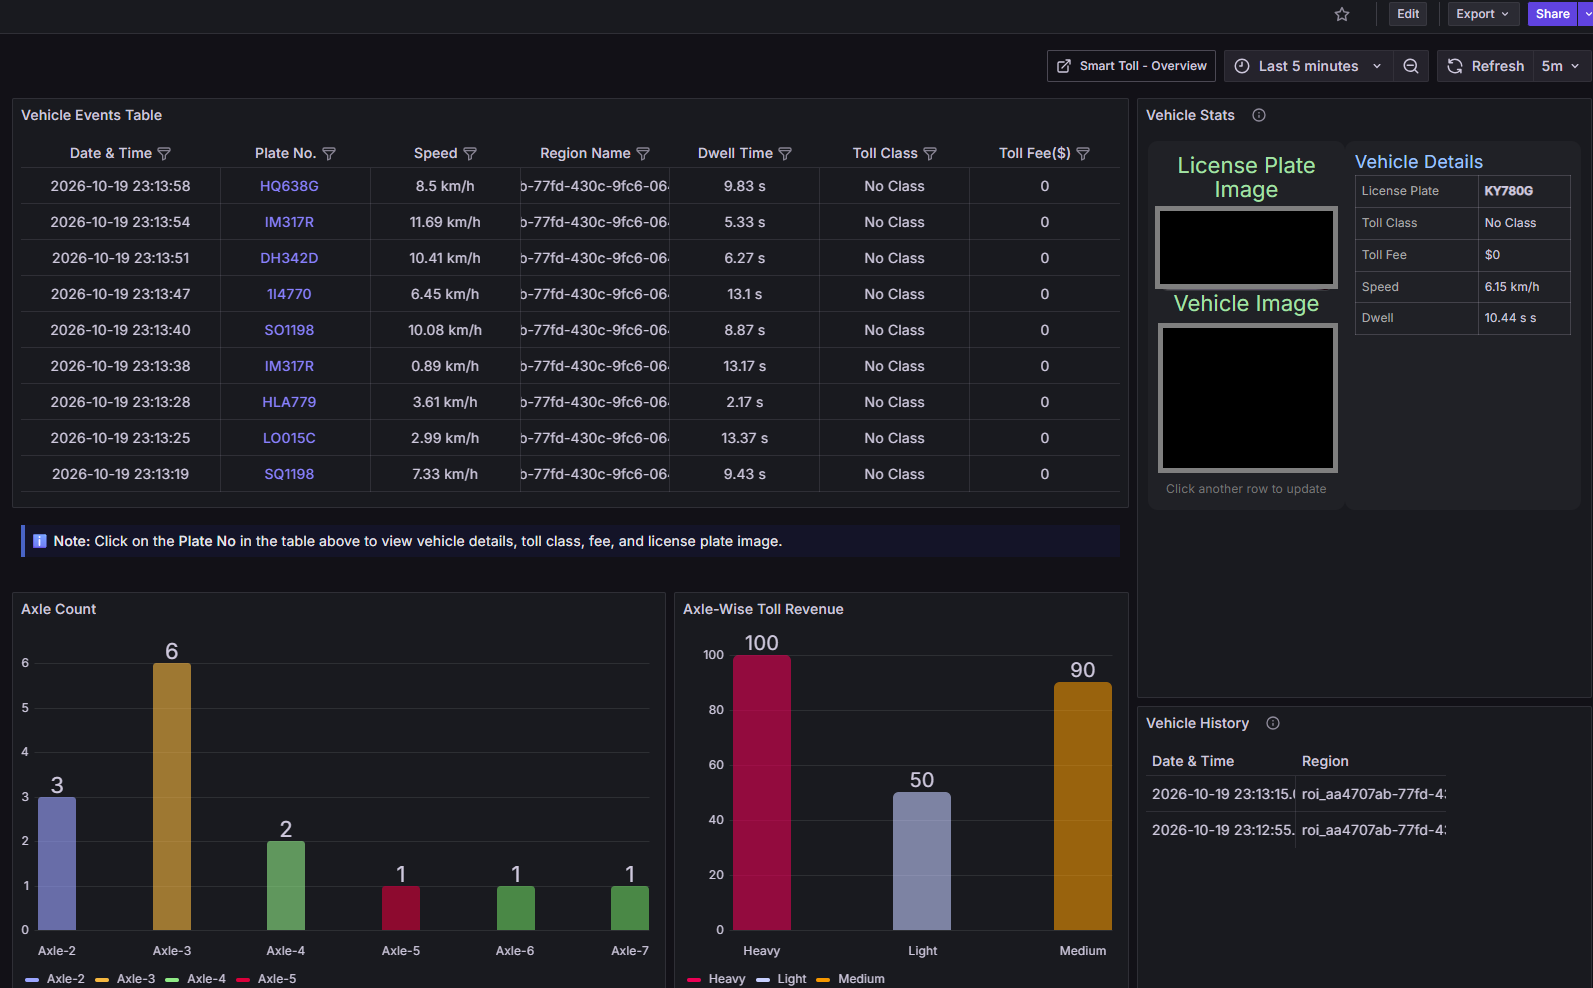
The system ships with pre-configured dashboards (Overview.json and
Vehicle_Events_Axle_Analysis.json) focusing on Traffic Volume, Flow Efficiency, and
Safety Alerts.
Note
The vehicle and license plate images in the screenshot above have been masked for privacy. Your own deployment will show the actual evidence images captured for each event.