Capturing Logs#
Orchestrator Logs#
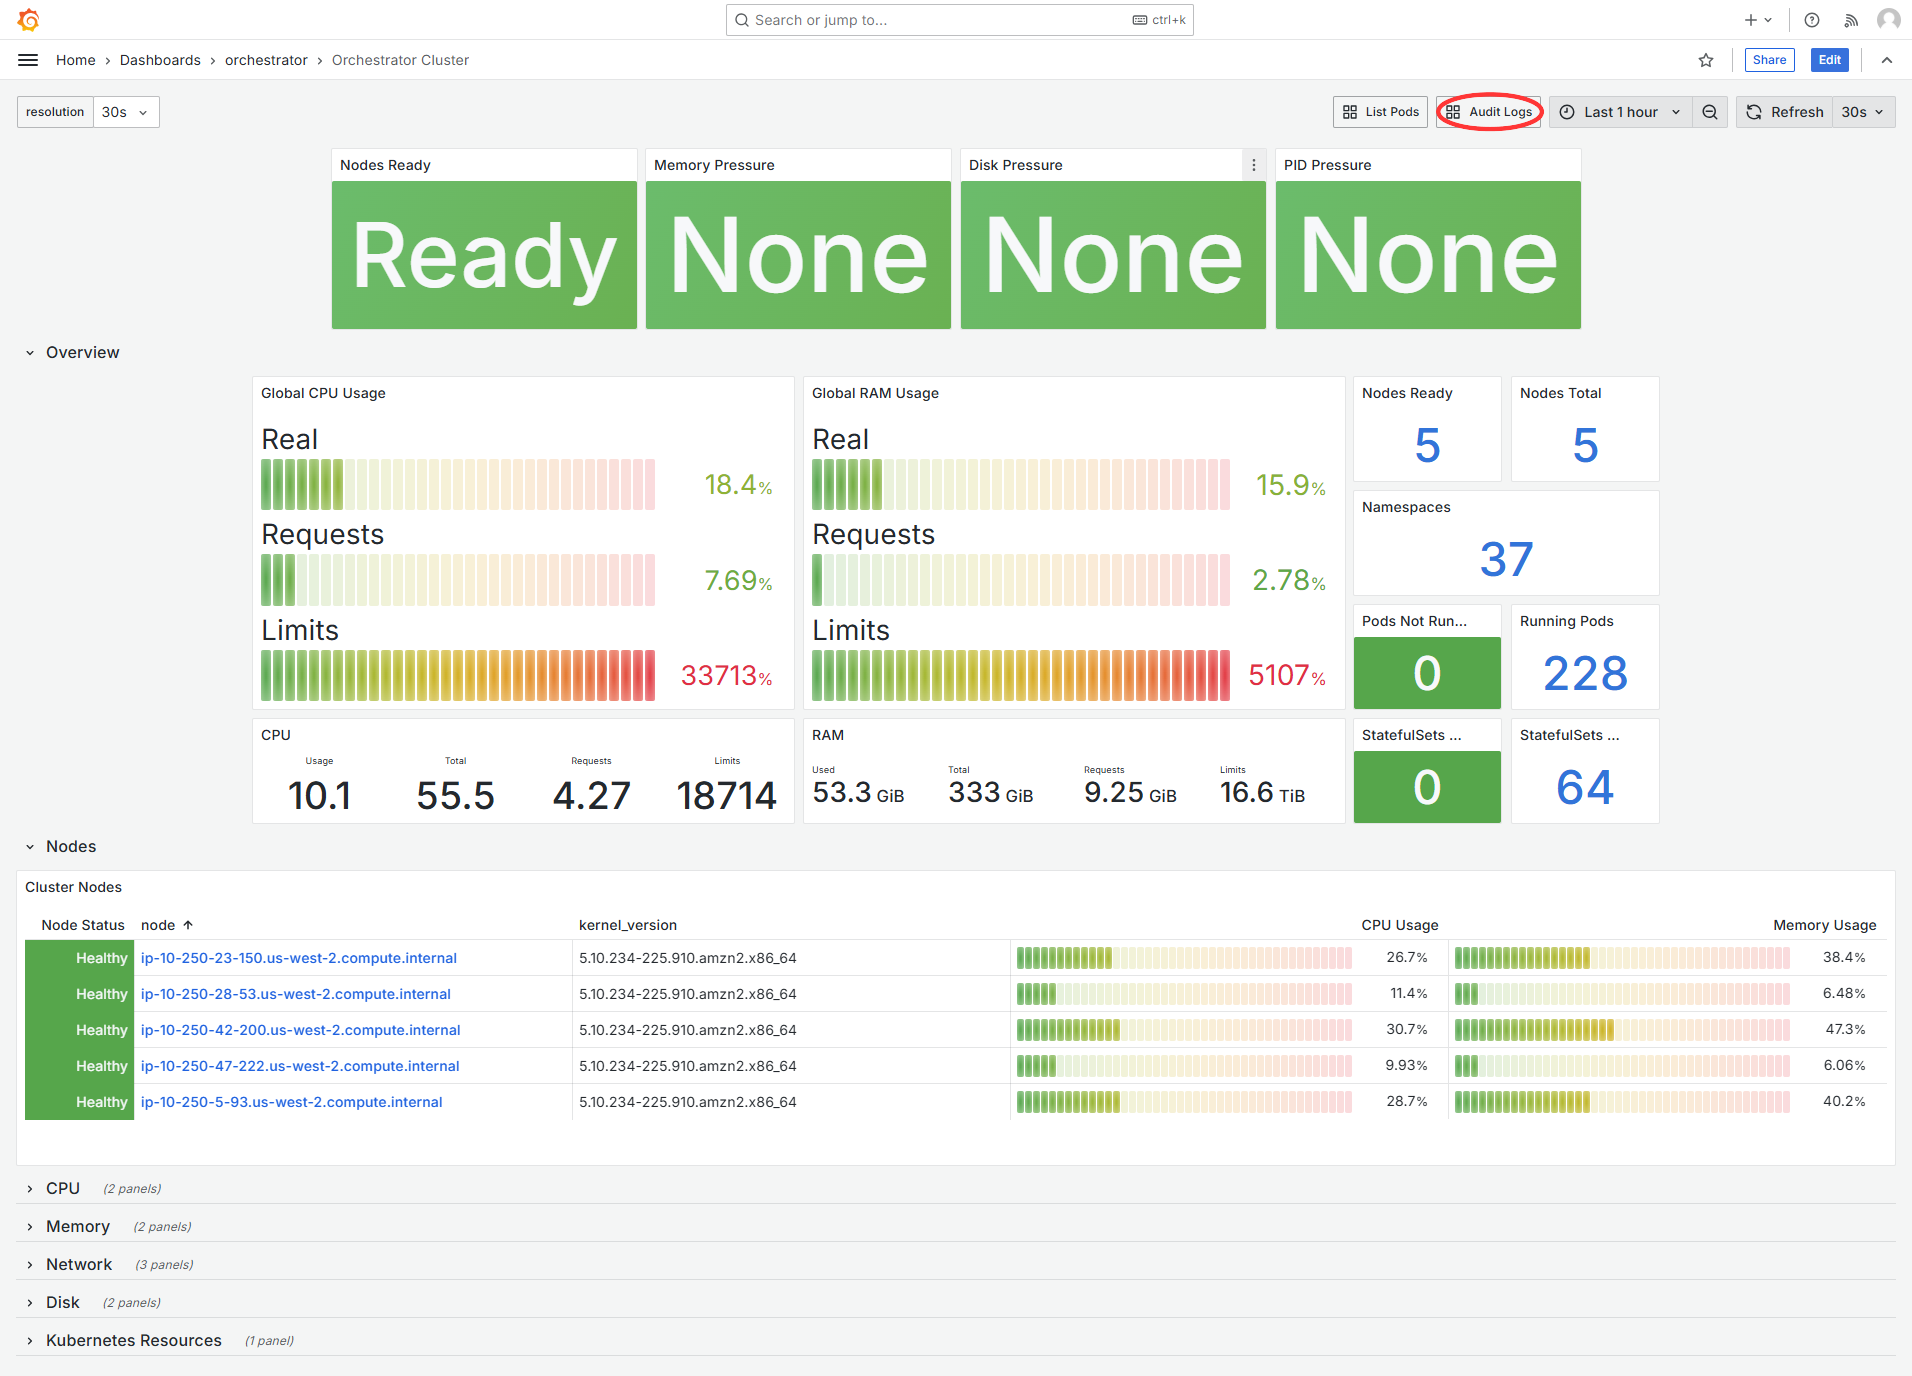
Orchestrator Logs are available in the observability-admin dashboards. To access these logs the user needs to be a member of either SRE-Admin-Group or Service-Admin-Group group.
From the Orchestrator Cluster dashboard, the logs can be accessed by clicking the Audit Logs button in the top right.
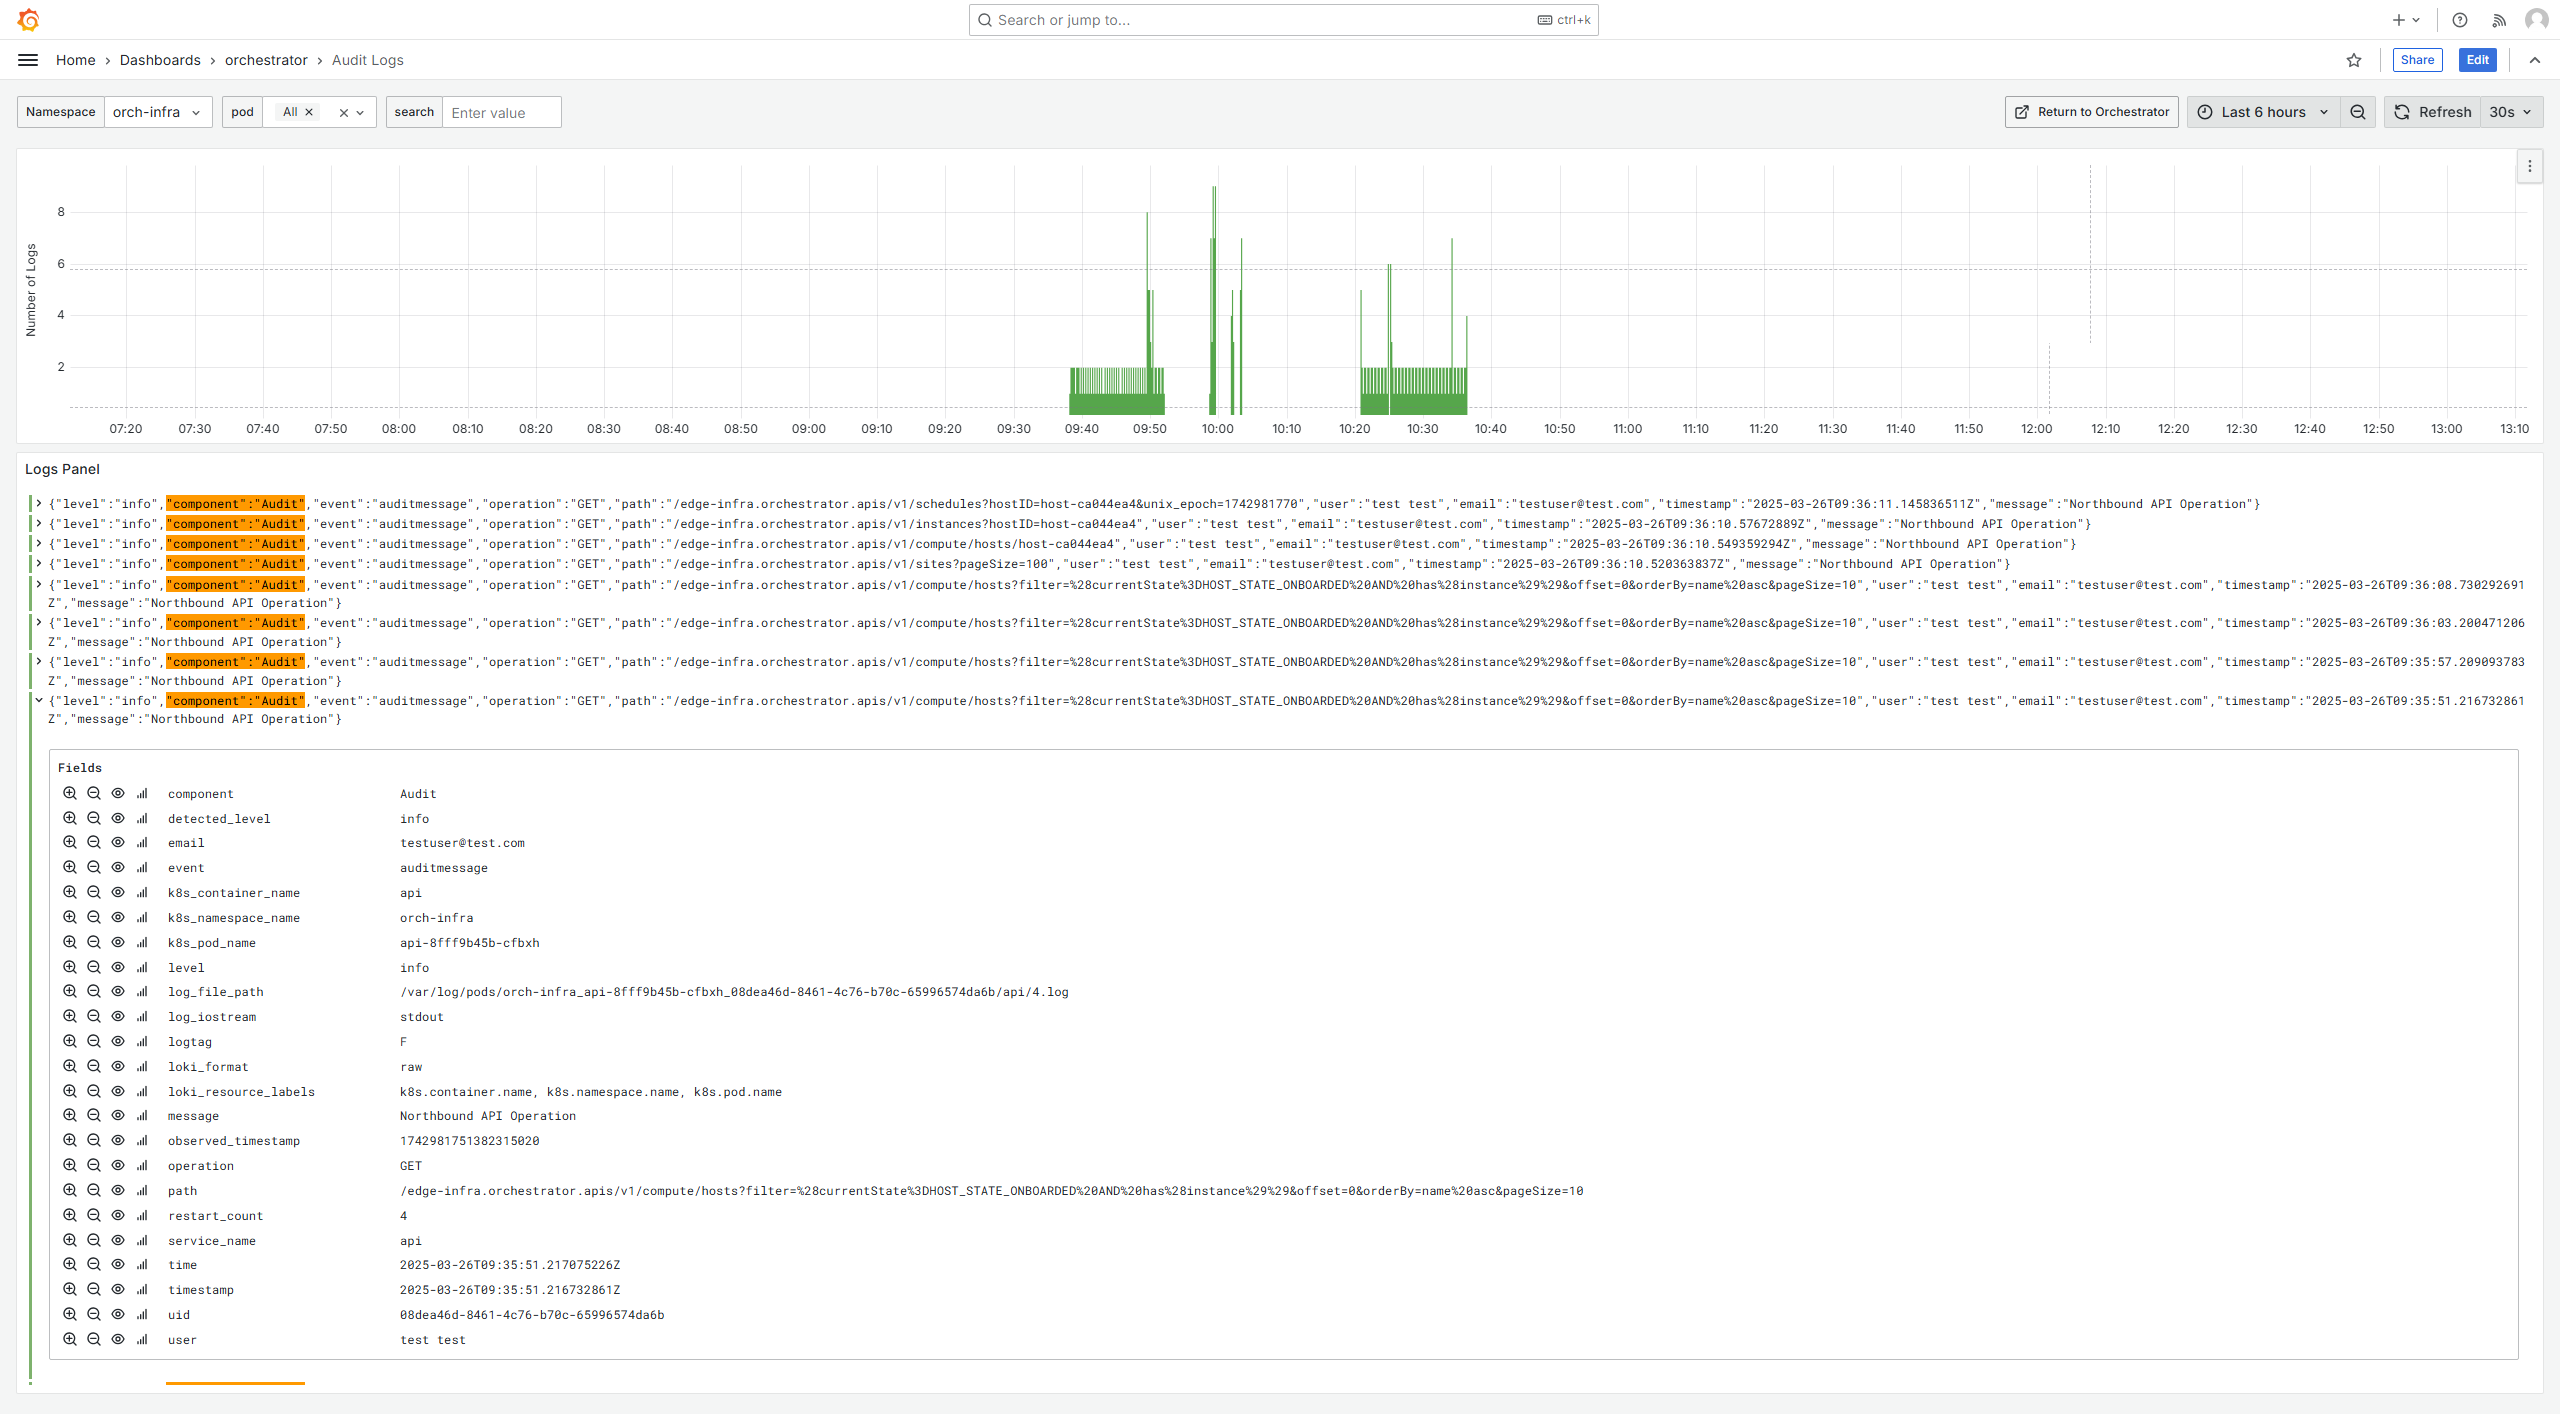
Audit Logs#
On Audit Logs dashboard you can filter service logs by namespace,
pod, and search strings to narrow down the search.
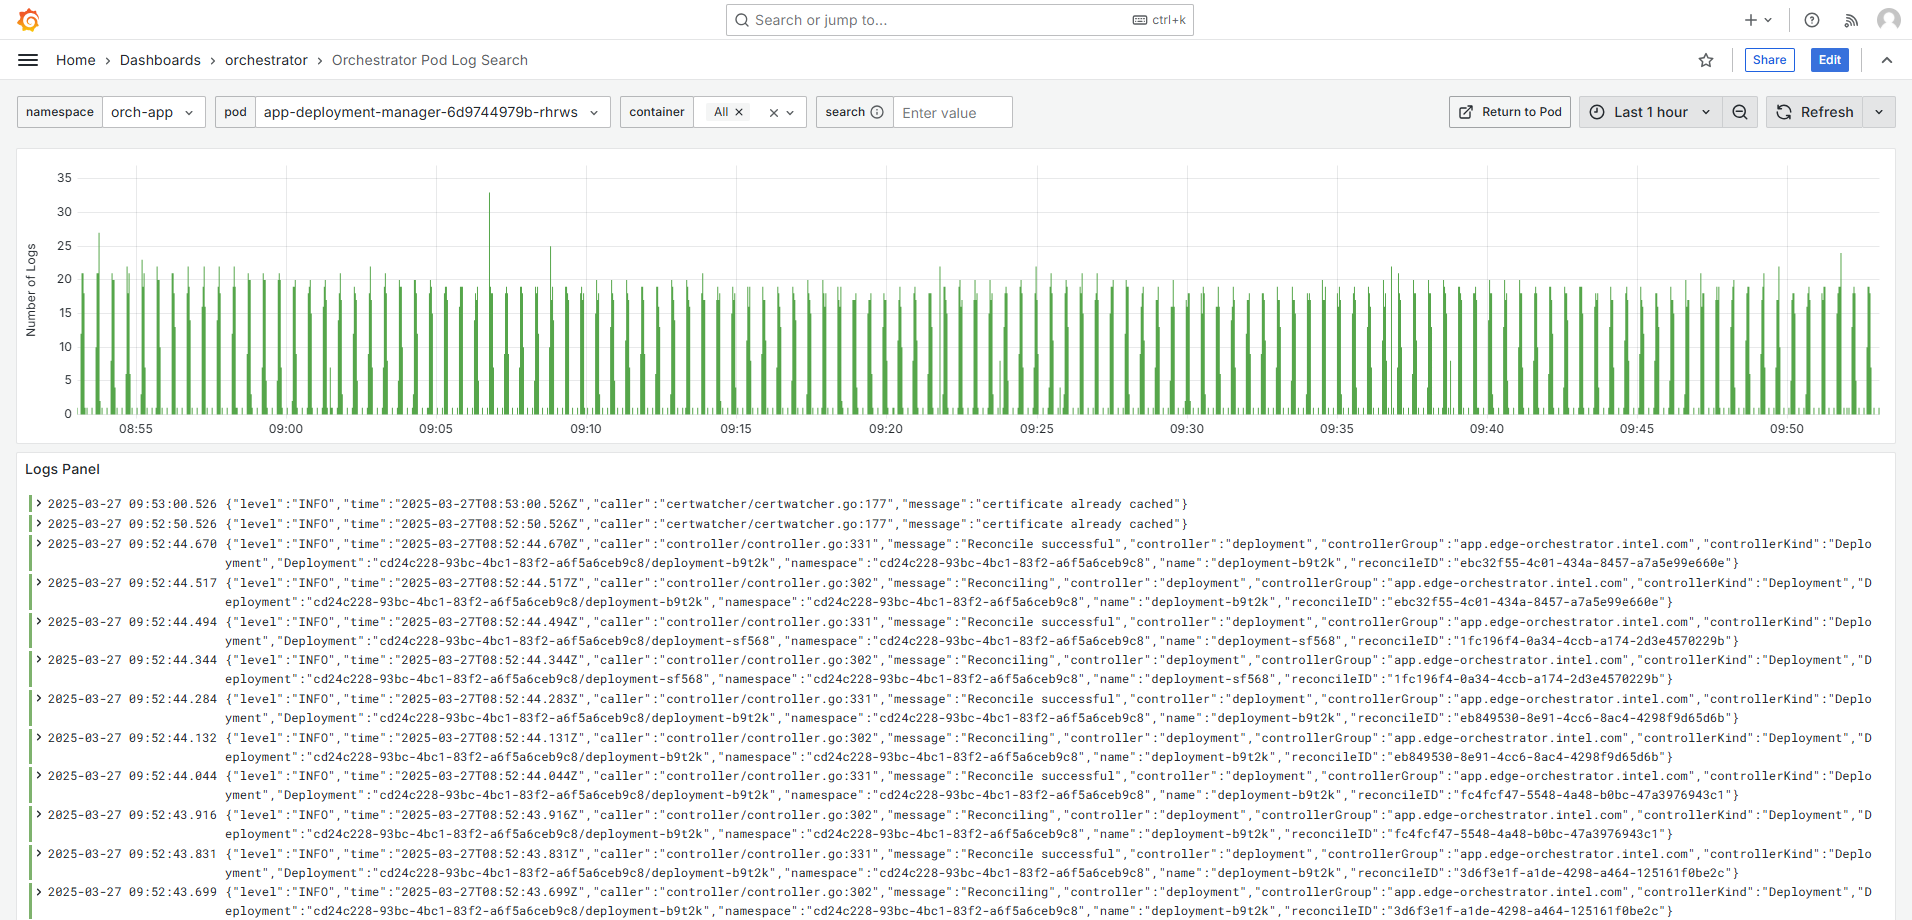
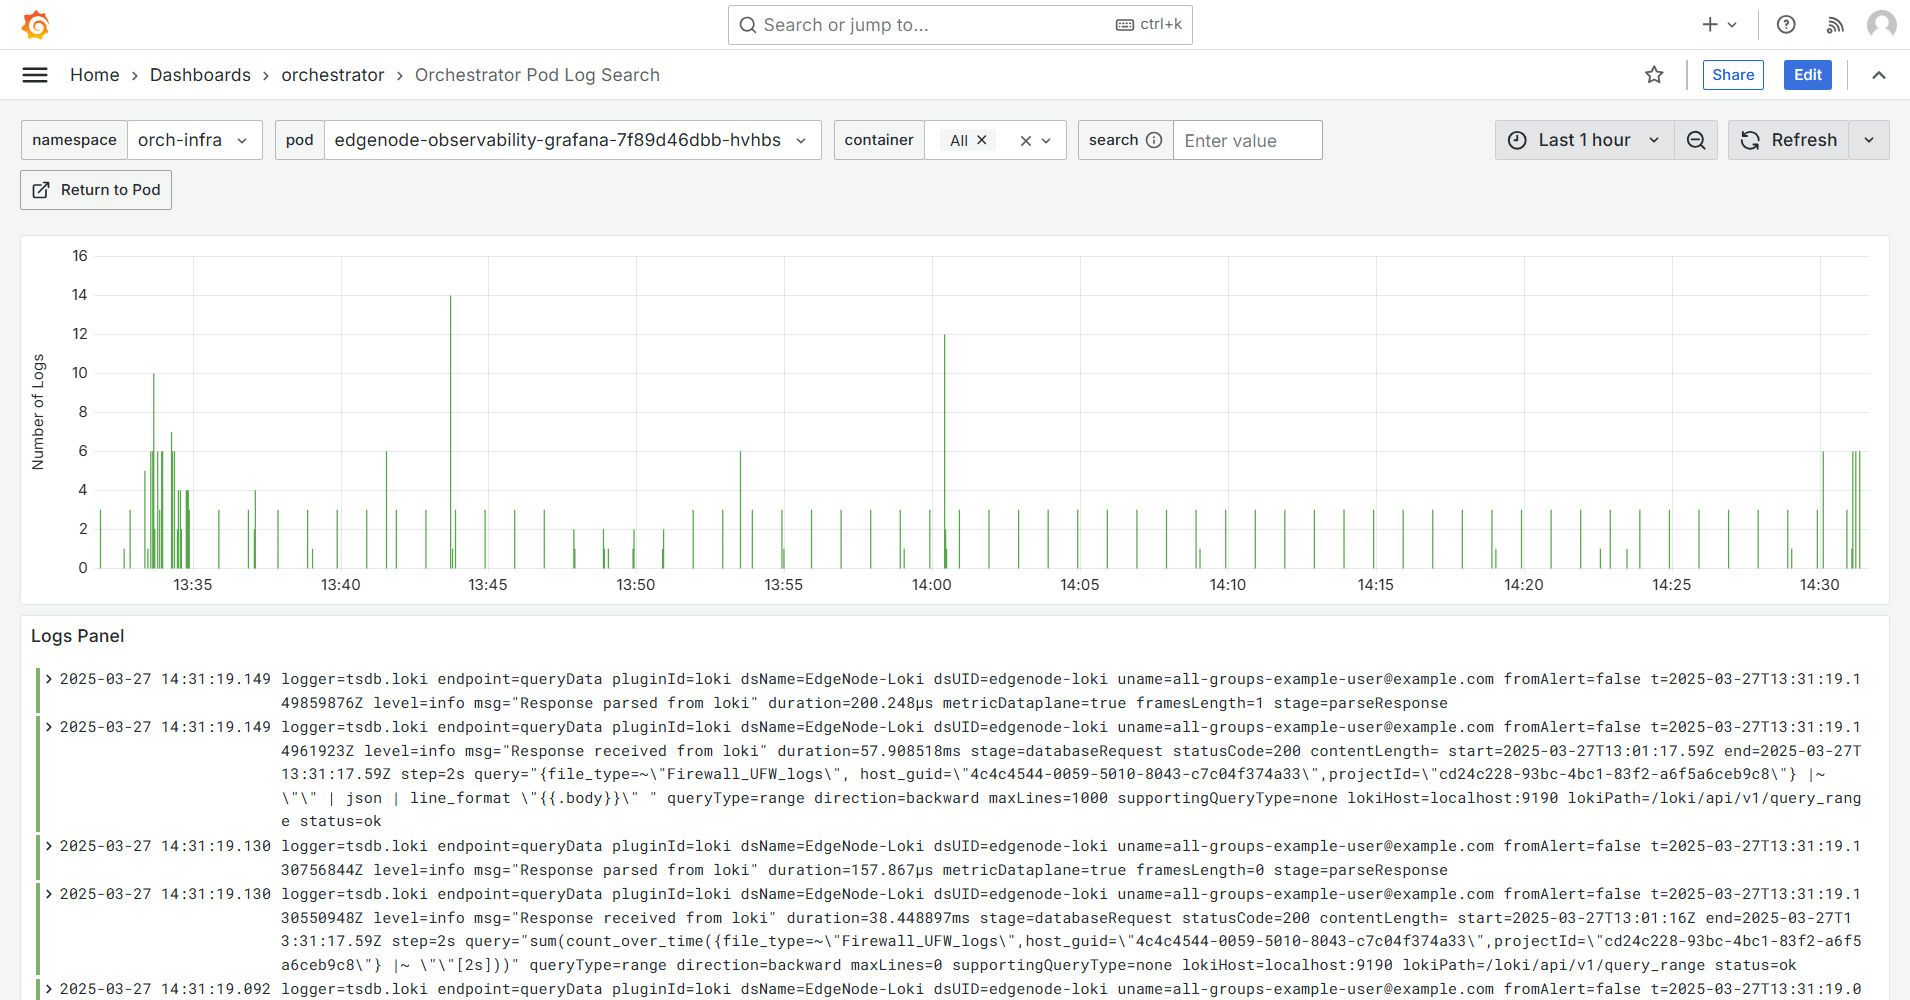
Orchestrator Pod Log Search#
To access the Orchestrator Pod Log Search dashboard, go to the main menu and
select Dashboards, then navigate to orchestrator, and choose
Orchestrator Pod Log Search.
On this dashboard you can filter logs by namespace, pod, container,
and search string to drill down to the particular service logs of interest.
Edge Node Logs#
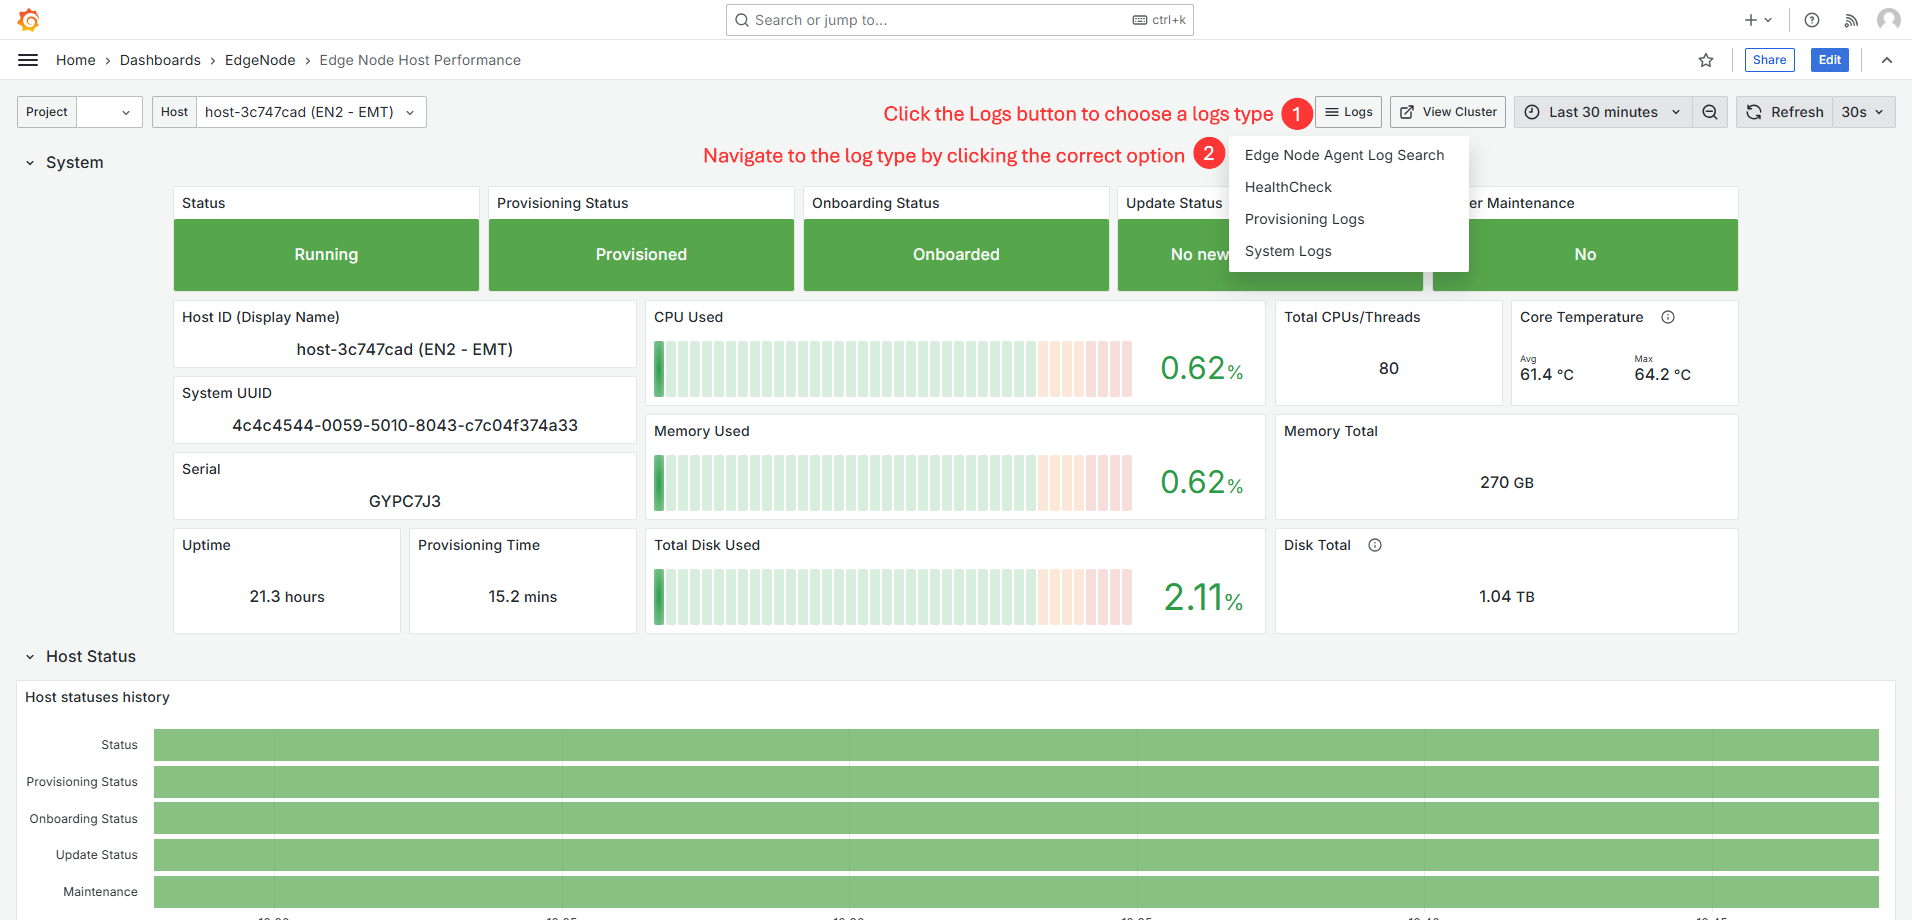
To view the Edge Node Host Performance metrics, you have two navigation options:
From the Web UI: Click on “View Metrics” to access the relevant dashboard.
From the Main Grafana Page: Navigate to the main Grafana page available at
https://observability-ui.<fqdn>. From there, you can access the dashboard by selectingDashboards>orchestrator>Edge Node Host Performance.
From the Edge Node Host Performance dashboard, you can click the Logs button to choose a log type: Edge Node Agent Log Search, HealthCheck, Provisioning Logs, or System Logs.
Pod Logs#
After selecting filters from the dropdowns above, the results will be displayed in the panels below. The number of logs panel indicates the frequency of the logs in the time period selected in the top right of the dashboard.
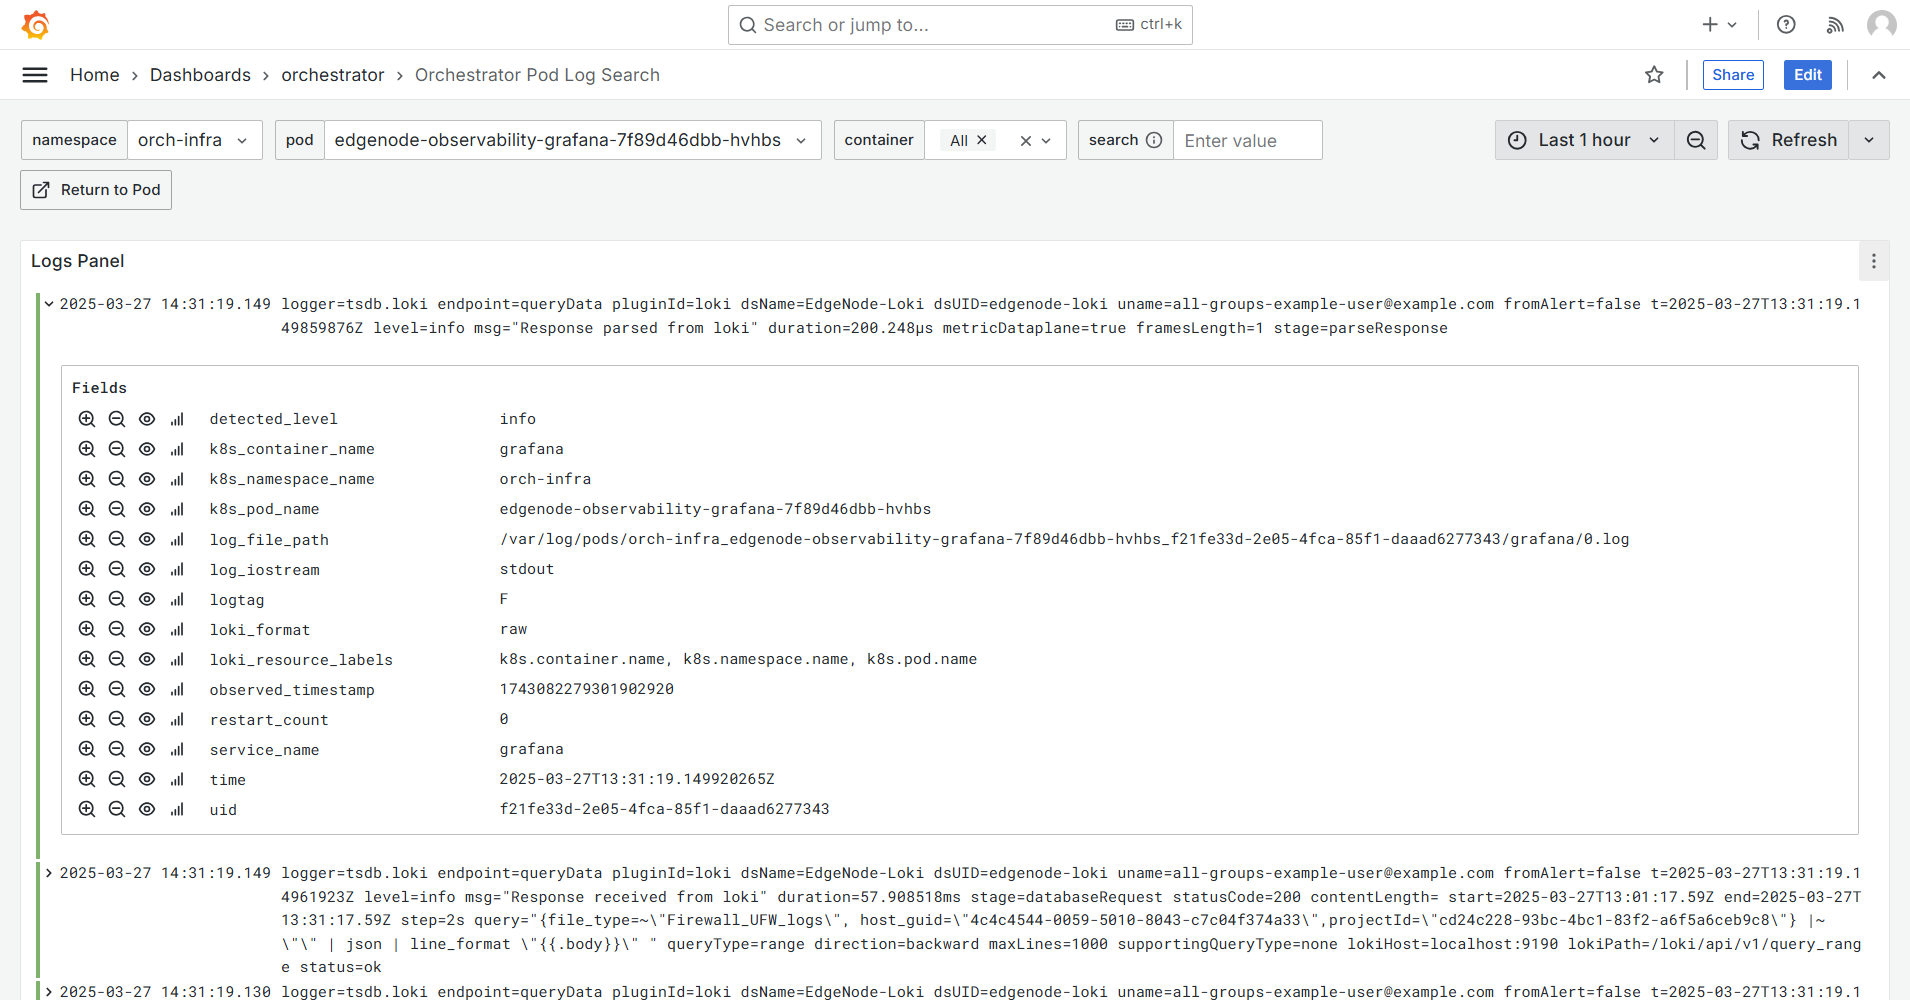
The logs panel shows the log lines found in the selected time period.
Each log entry can be expanded to reveal more details.
Agent Logs#
Agent logs are generated from the bare-metal agents running on the edge node.
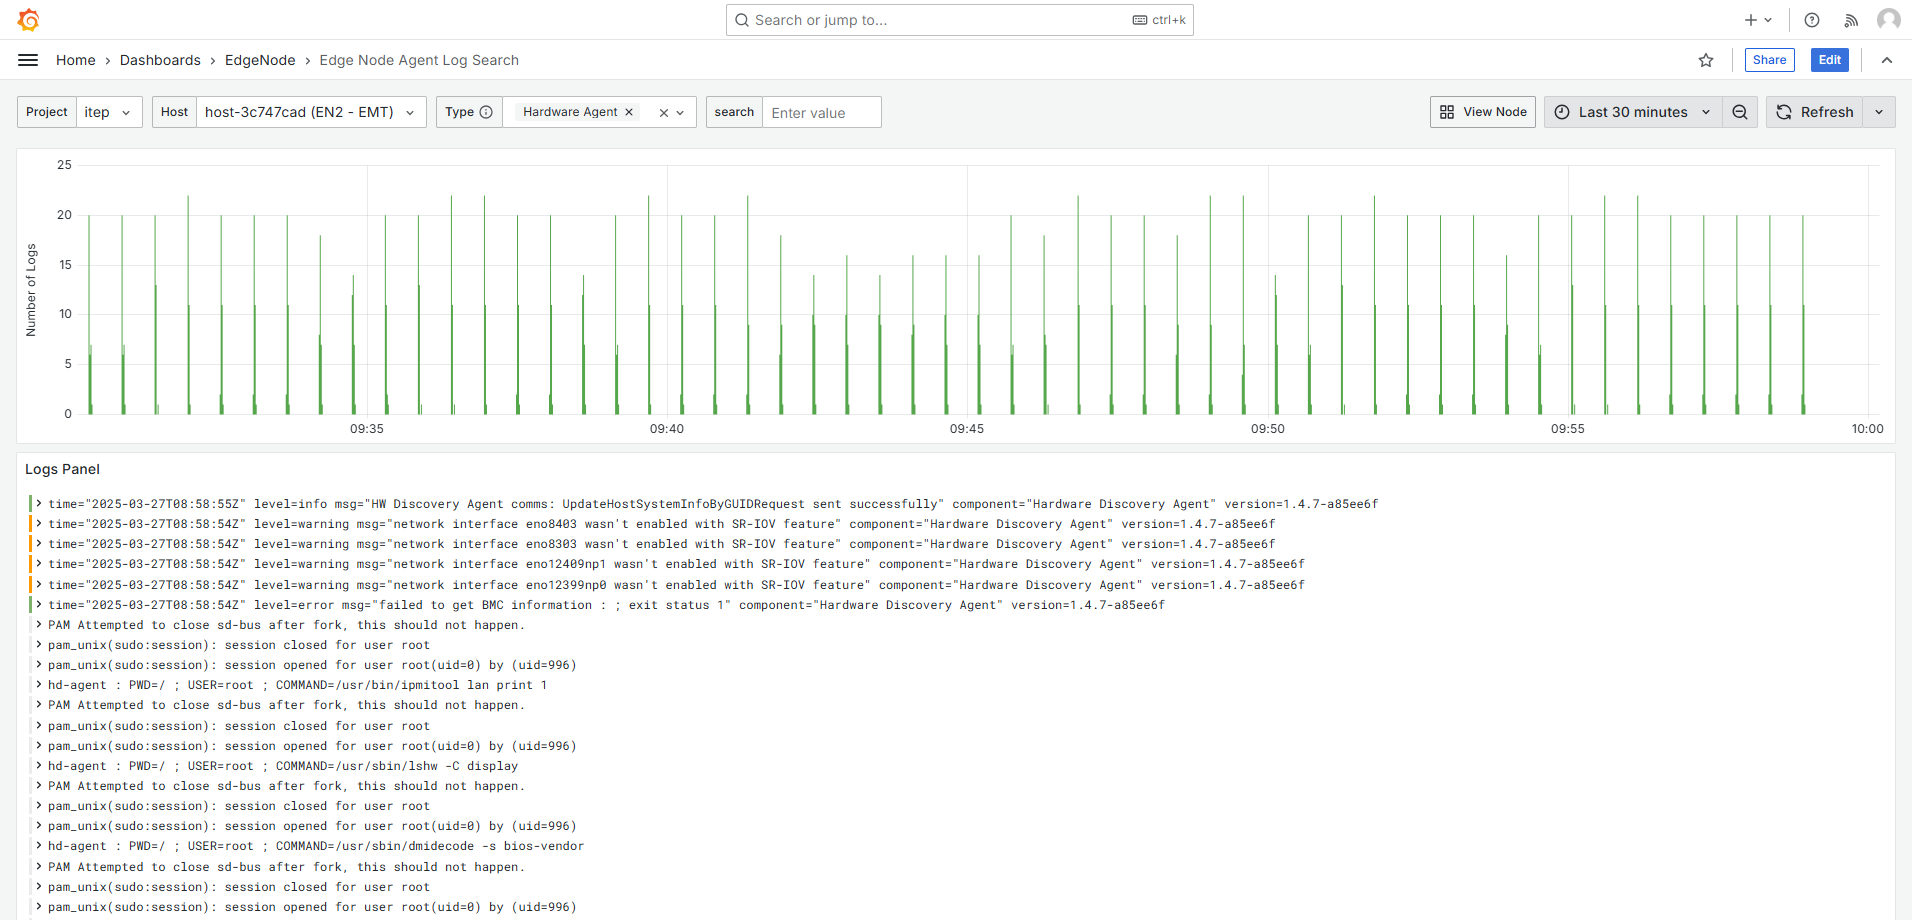
The available agents are:
Cluster Agent
Hardware Agent
License Agent
Node Agent
OpenTelemetry Collector
Platform Update Agent
Platform Telemetry Agent
RKE Server
RKE System Agent
Caddy
Telegraf
Installer
Apt Install History Logs
INBM
INBM Dispatcher
INBM Configuration
INBM Diagnostic
INBM Telemetry
INBM Update Status
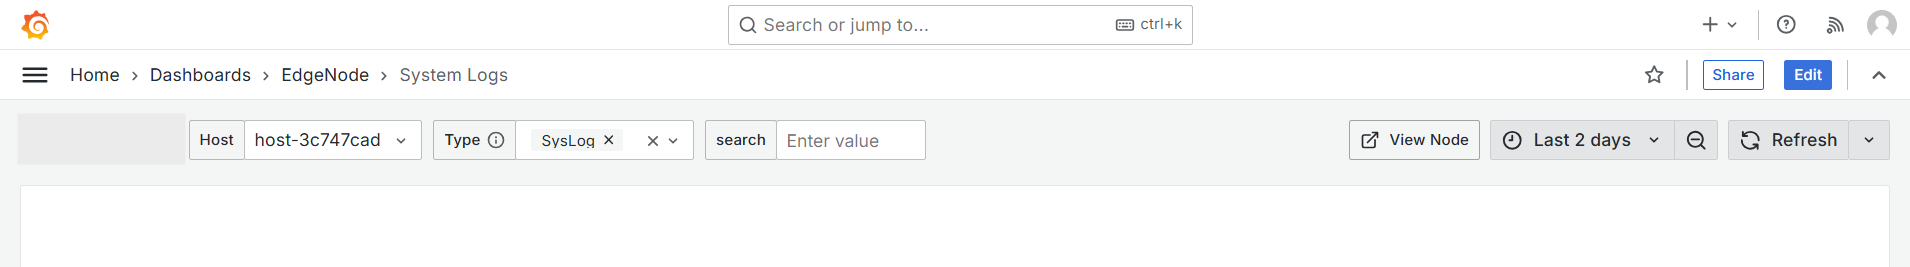
System Logs#
System logs contain system-level logs of the edge node There 3 types:
UFW
SysLog
Kernel
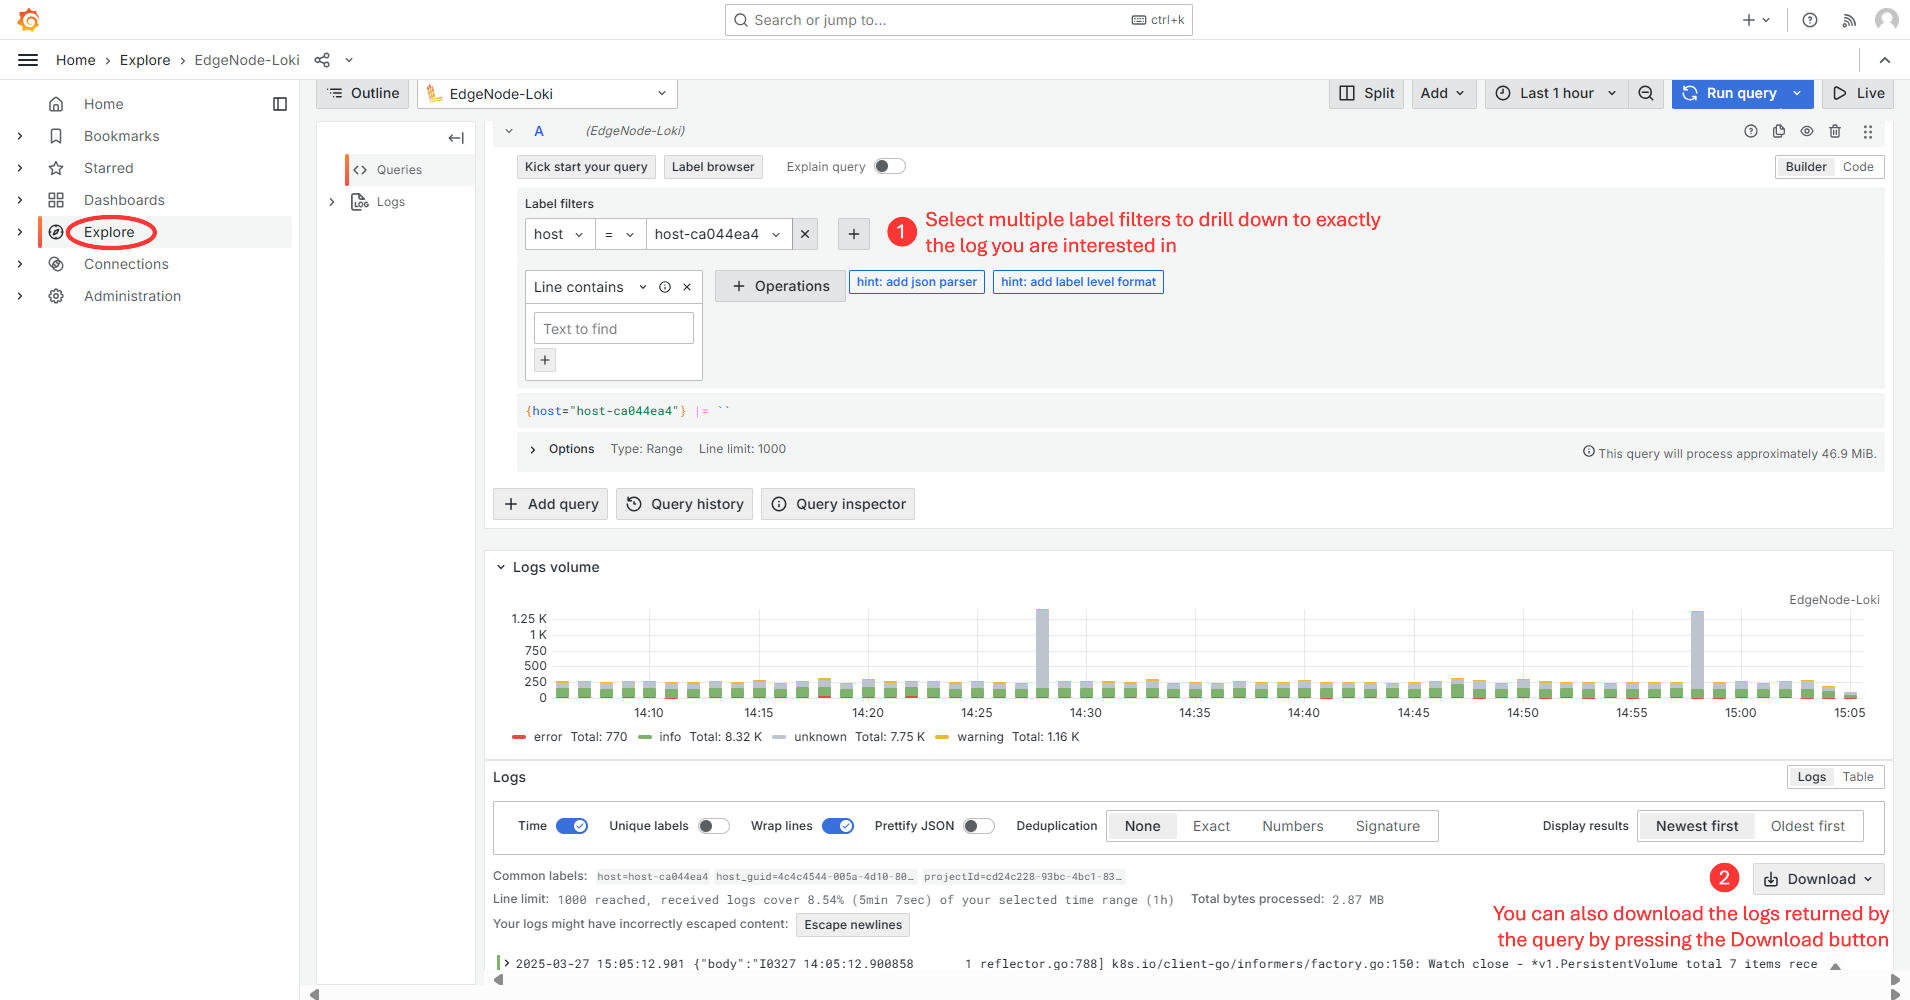
Explore Feature#
The Explore tab allows for more in-depth searches.
In the explore window, you can select multiple label filters to drill down to exactly the log you are interested in.
For example, in the screenshot below, I am searching for the Host logs.
From the explore window, you can also download the logs returned by the query by pressing the Download button.