This document provides a comprehensive view of Edge Manageability Framework
observability platform and an overview of key components that help you to
monitor, analyze, and troubleshoot the Edge Nodes and Edge Manageability Framework
itself.
Administrative access allows reviewing data across multiple projects - see
Multitenancy to learn more about multi-tenancy concepts in
Edge Manageability Framework Observability.
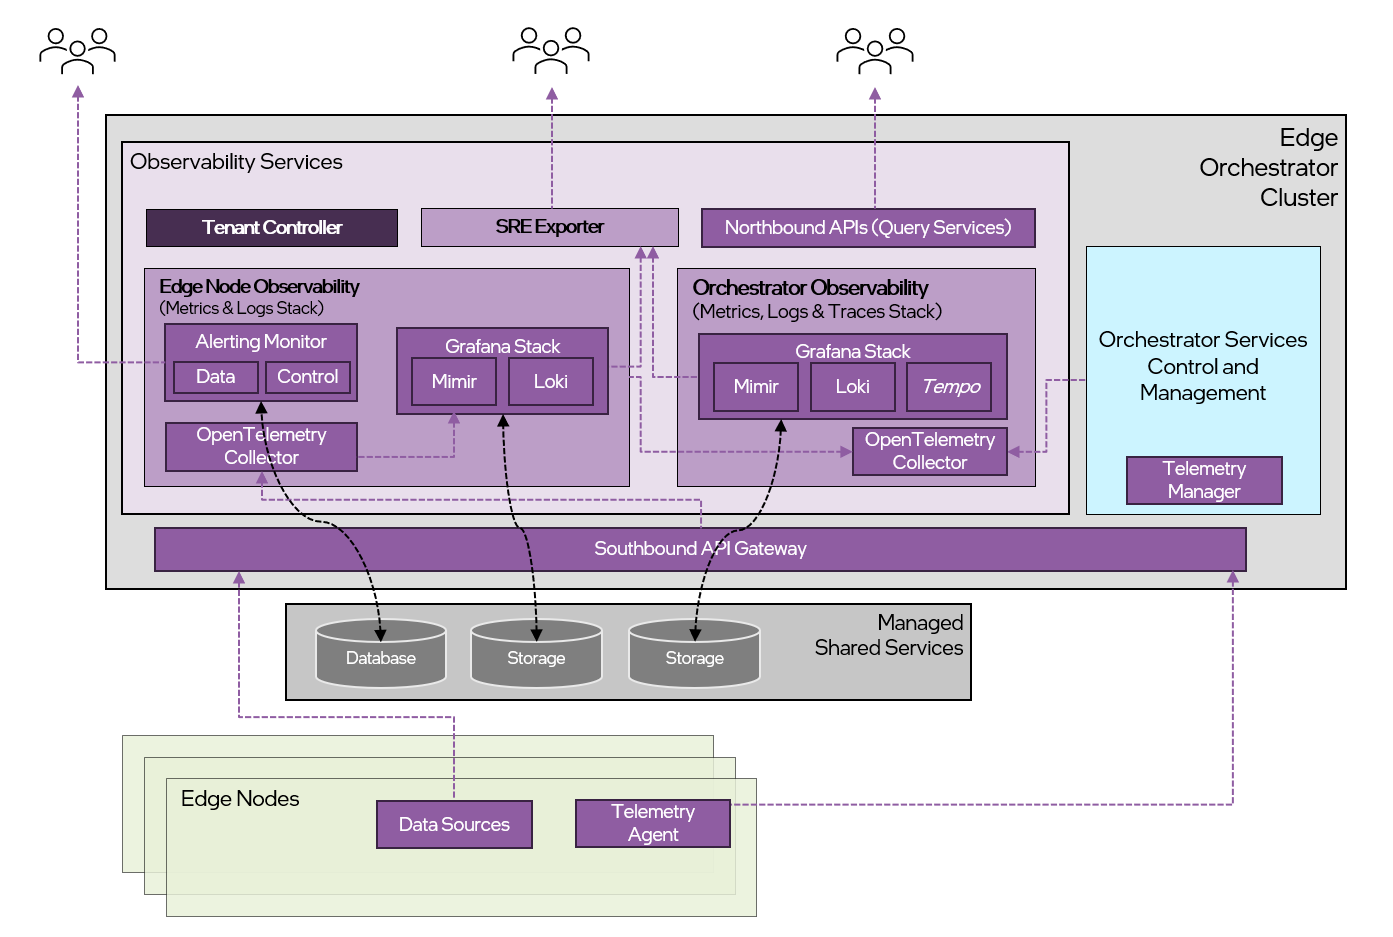
The range and quantity of data collected from the Edge Node Agents can be
controlled via Edge Infrastructure Manager’s Telemetry Control subsystem.
Refer to Edge Node Platform Telemetry Agent
for more details.
Since Edge Manageability Framework is designed to manage multiple Edge Nodes, the
observability stack needs to scale accordingly. Refer to
Scalability section for more details.
Based on project-level access granted, users can review a subset of data
collected for allowed projects - please see Multitenancy to
learn more about multi-tenancy concepts in Edge Manageability Framework Observability.
Based on the collected data, the Alerting Monitor component can trigger alerts
and notifications. Refer to Alerting Monitor for more
details. This component exposes an Alerts API that can be used to query and
manage alerts per project.
Site Reliability Engineers (SRE) can use the SRE Exporter to export
observability data from Edge Manageability Framework to external monitoring systems
using Prometheus format. Refer to Site Reliability Engineering (SRE) Exporter for more
details.