Access Applications#
After the application is deployed with the default Deployment Profile, you can access it from the Web UI.
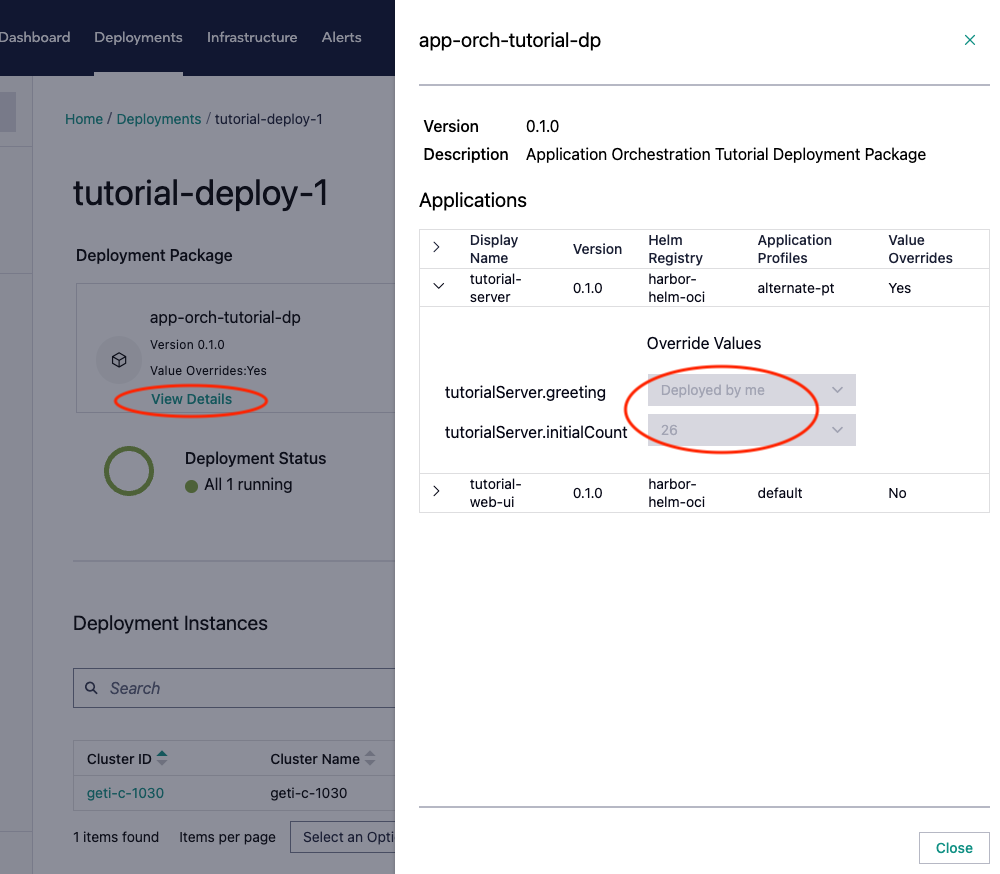
In the Deployments page you can view the details of the deployed application. With this you can see the status of the application, the profile used for deployment, and in the details the values used for the parameters in the profile.
Clicking on the cluster link you can see how the application is deployed to an Edge Node cluster.
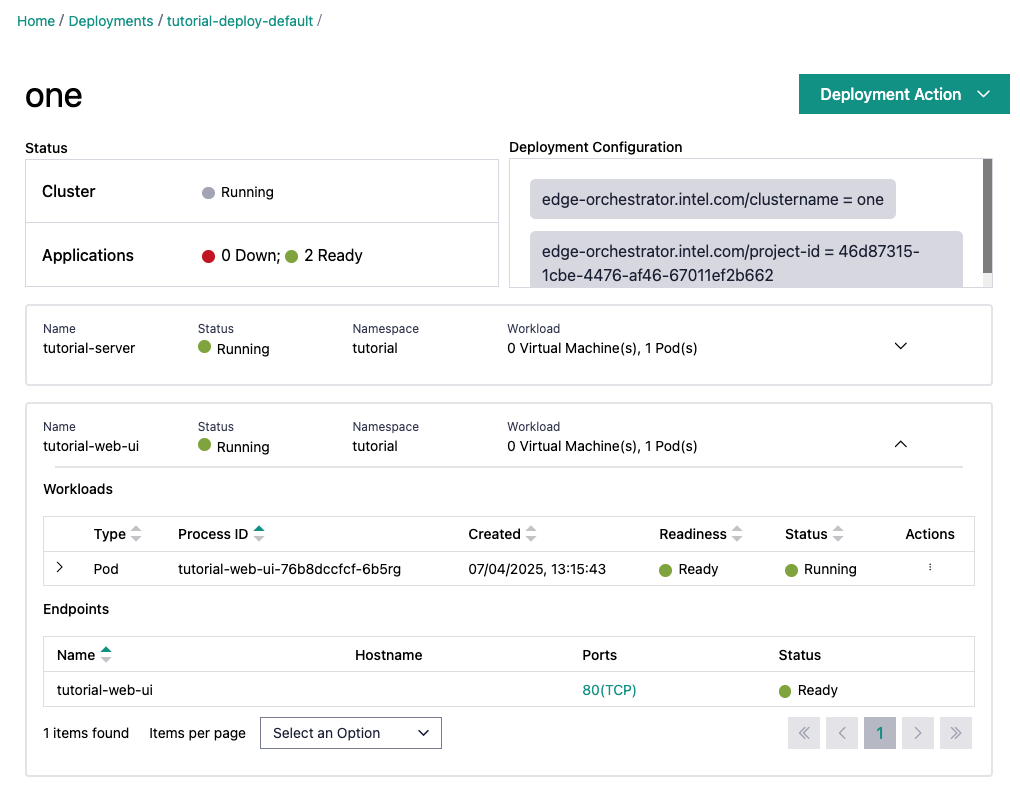
Here, you can see both the tutorial-server and tutorial-web-ui applications in this single deployment on this cluster. The tutorial-web-ui is expanded, and you can see the Service Link that was created earlier by annotation of the service.
Select the link to open a new browser window that will redirect to the Tutorial Web UI page.
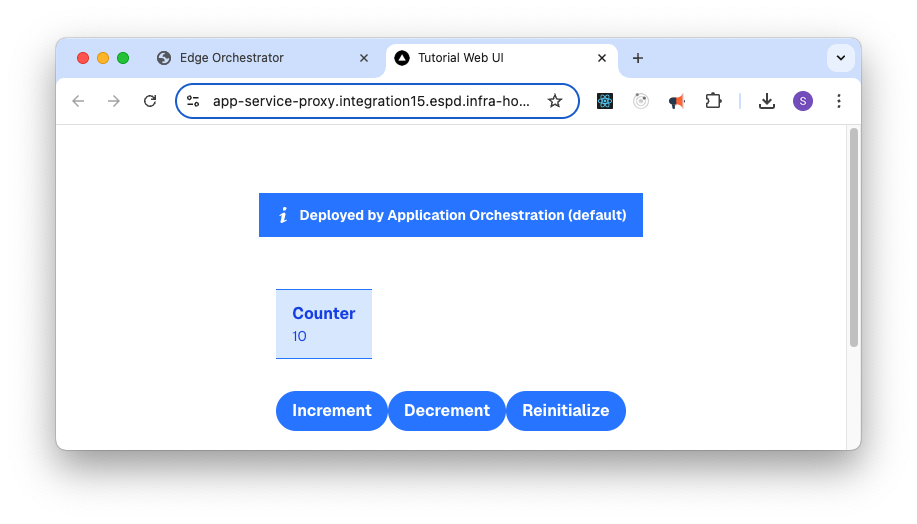
From the UI, you can infer the following:
The web ui is deployed and running properly
The tutorial server is deployed and running properly
The tutorial server is getting the initial variables from the parameter in the Profile
The counter is getting initialized at 26 (from the parameter in the profile)
The tutorial server is reachable from the web ui through the NGINX* proxy
You can also change the counter value in the alternate profile and deploy it to see how the web ui changes.
Similarly, see the alternate-pt profile to see how the parameter templates work during deployment.
Understand the Deployment#
You can download the KubeConfig from the edge node to explore it further. See Clusters for more information on how to do this.
Once established, you can see all the resources that have been created by the Application Orchestrator.
kubectl -n tutorial get all
This should give an output like:
NAME                                   READY   STATUS    RESTARTS   AGE
pod/tutorial-server-78585ff665-sxlq6   1/1     Running   0          21m
pod/tutorial-web-ui-76b8dccfcf-6b5rg   1/1     Running   0          21m

NAME                      TYPE        CLUSTER-IP      EXTERNAL-IP   PORT(S)    AGE
service/tutorial-server   ClusterIP   10.43.1.115     <none>        8000/TCP   21m
service/tutorial-web-ui   ClusterIP   10.43.139.158   <none>        8080/TCP     21m

NAME                              READY   UP-TO-DATE   AVAILABLE   AGE
deployment.apps/tutorial-server   1/1     1            1           21m
deployment.apps/tutorial-web-ui   1/1     1            1           21m

NAME                                         DESIRED   CURRENT   READY   AGE
replicaset.apps/tutorial-server-78585ff665   1         1         1       21m
You can see how the Helm* chart has been deployed as a Deployment and Service. The Application Orchestrator has also created supporting items:
kubectl -n tutorial get secret
NAME                                                           TYPE                             DATA   AGE
b-d79db76a-5a73-5f1a-befa-39568c4d2c10                         kubernetes.io/dockerconfigjson   3      4m12s
b-ec7b9684-61c5-5c98-b7c2-9ecace3aefa6                         kubernetes.io/dockerconfigjson   3      4m13s
sh.helm.release.v1.b-d79db76a-5a73-5f1a-befa-39568c4d2c10.v1   helm.sh/release.v1               1      4m12s
sh.helm.release.v1.b-ec7b9684-61c5-5c98-b7c2-9ecace3aefa6.v1   helm.sh/release.v1               1      4m13s
The first two secrets are the Docker* credentials for the Application Orchestrator to pull the images from the registry. The others are the Helm release secrets that are used to track the deployment of the Helm chart.
kubectl -n tutorial get networkpolicy
NAME                                  POD-SELECTOR   AGE
tutorial-server-0.1.0-w8jg6-egress    <none>         5m39s
tutorial-server-0.1.0-w8jg6-ingress   <none>         5m39s
tutorial-web-ui-0.1.0-w8jg6-egress    <none>         5m40s
tutorial-web-ui-0.1.0-w8jg6-ingress   <none>         5m40s
The Application Orchestrator has created Network Policies to allow the applications to communicate with each other.
Monitor the Deployment#
To monitor the Tutorial application and view its logs, refer to Edge Node Host Performance Dashboard in the User Guide.