Alerting Monitor#
The Alerting functionality:
Introduces additional components (
Alerting Monitor Systemconsisting ofAlerting MonitorandPrometheus Alertmanager).Adds extensions to existing components (
Grafana Mimir RulerinEdge Node Observability Stack).Integrates with other
Edge Orchestrator Services(Identity and Access Management System,Infrastructure ManagementorGraphical User Interface).
It depends on established flow of telemetry data from Edge Nodes to the
Edge Node Observability Stack and the presence of external Email Server
for delivering emails.

Overview#
To expose configurable Alerting capability, Alerting Monitor service
introduces a REST API that:
is backed by its own configuration database
allows reconfiguration of stored alert definitions
relays alert and storage to dependent component (
Prometheus Alertmanager)aggregates, transforms, and filters alert data obtained via proxying requests to
Prometheus Alertmanager
The Alerting Monitor service’s responsibility is also maintenance of
coherent alerting configuration of dependent components via a set of internal
controllers referred to as External Services Controller:
Grafana Mimir Ruler: part ofEdge Node Observability Stackthat is the main generator of rules-based alerts fromEdge Nodestelemetry.Prometheus Alertmanager: standalone component ofAlerting Monitor Systemthat is responsible for grouping, routing, and sending alerts through email channel.
Deployment#
Alerting Monitor is deployed in HA mode and supports operation of multiple
replicas, but with just only one instance at a time actively controlling
(modifying) the configuration of dependent components. Coordination of tasks
between replicas is done via service’s transactional database. A
reconfiguration task executed by a replica implements a timeout, so if this
replica fails, the task can be picked up by another replica. Alerting Monitor
uses Horizontal Pod Autoscaler (HPA) to dynamically scale the number of its
replicas.
The service exposes both liveness and readiness Kubernetes probes. The
service is considered alive and ready to accept API requests when:
Service startup from supplied configuration is completed.
Database initialization/migration procedures are complete.
Connectivity to dependent services is verified.
The Prometheus Alertmanager dependent component is deployed in cluster mode
(all replicas are receiving alerts from Grafana Mimir Ruler) and is
responsible for deduplication and grouping of all received alerts.
Internally, the service is composed of the following sub-components:
alerting-monitorcore service that exposes REST API for alert configuration management and reconfiguration of dependent services.open-policy-agent(OPA) policy engine for API access control.managementexposes gRPC API to reload configuration for handling Multitenancy.
Refer to Multitenancy section for more details on how multitenancy in observability is handled.
Configuration#
The service is supplied with a YAML based configuration containing default
alert definitions that conform to Prometheus alerting rules schema.
This configuration is additionally templated via Helm Chart to support
different evaluation and aggregation intervals.
This default alerts configuration is used to populate the database with initial definitions to be applied and can be used to restore default actions.
The service is supplied with a YAML based configuration containing
configuration required for alert delivery channel. The only supported
Receiver type is email and it needs to conform to Prometheus
Alertmanager email_config schema.
This default alert delivery channel configuration is applied to all alerts managed by the service.
The service supports graceful shutdown since configuration reloading may require restart.
Refer to Developing Alert Email Notifications section for detailed information on configuring the Alerting Monitor Email Notifications.
REST API (Northbound)#
The exposed Northbound API is proxied through Multi Tenancy API Gateway. Refer to API Guide for detailed Alerts API reference.
REST API requests originating are handled:
Asynchronously if they translate to requests that require changing the configuration of other services.
Synchronously if they translate to only read requests on dependent services.
Asynchronous API call example#

Synchronous API Call Example#

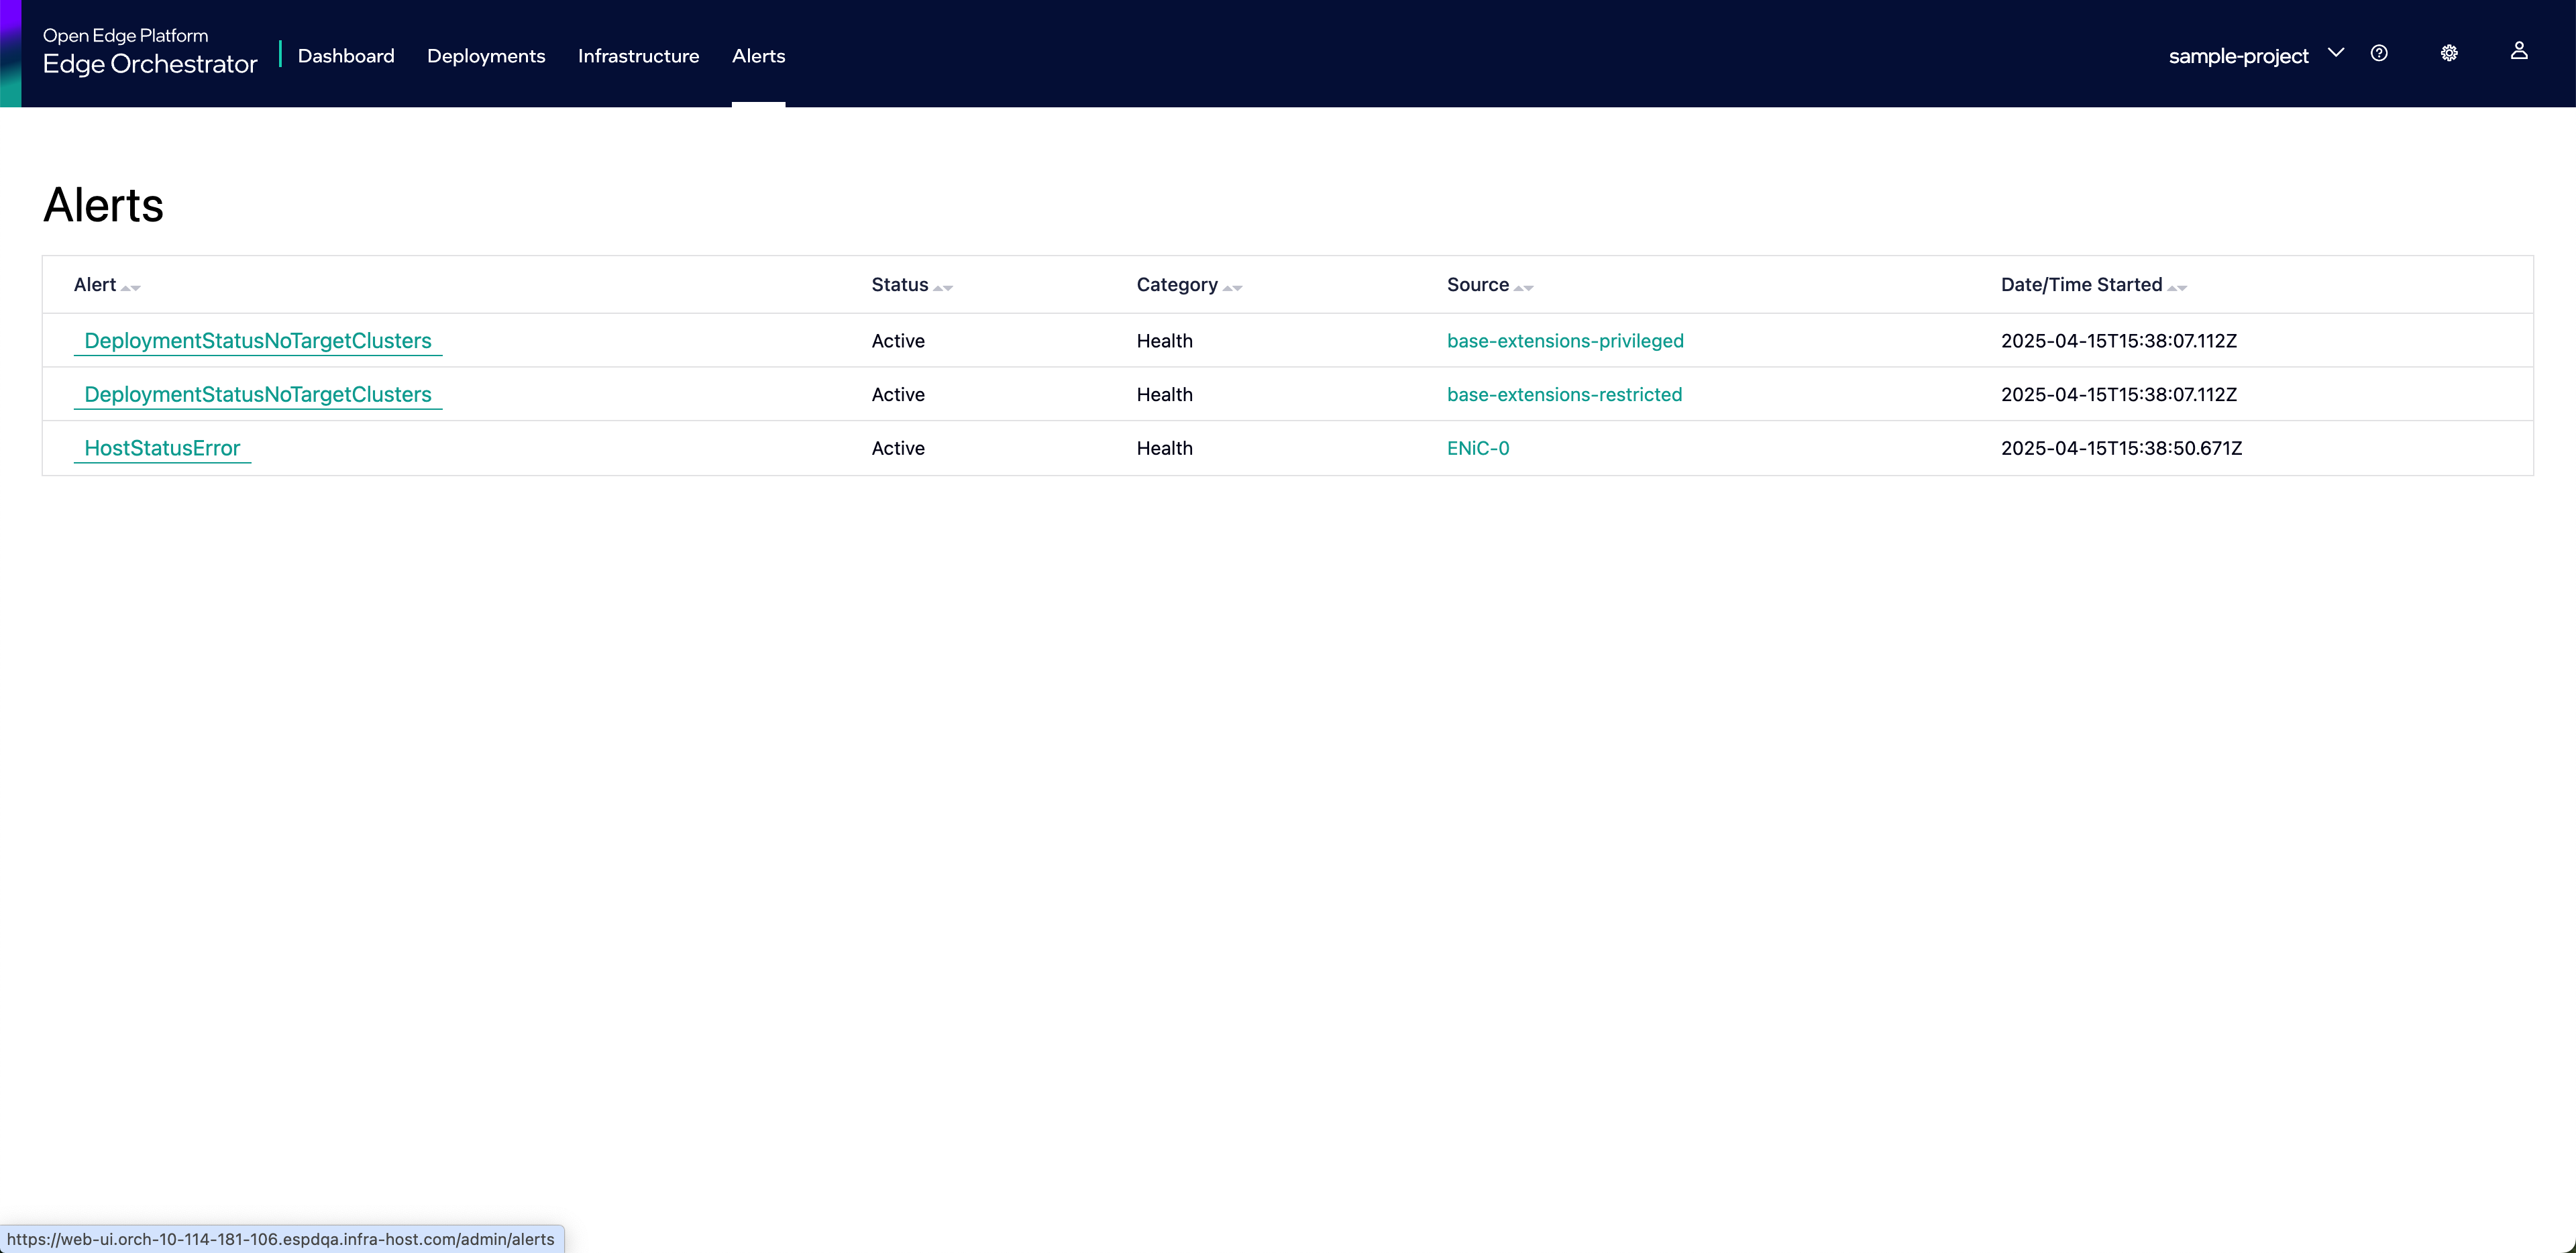
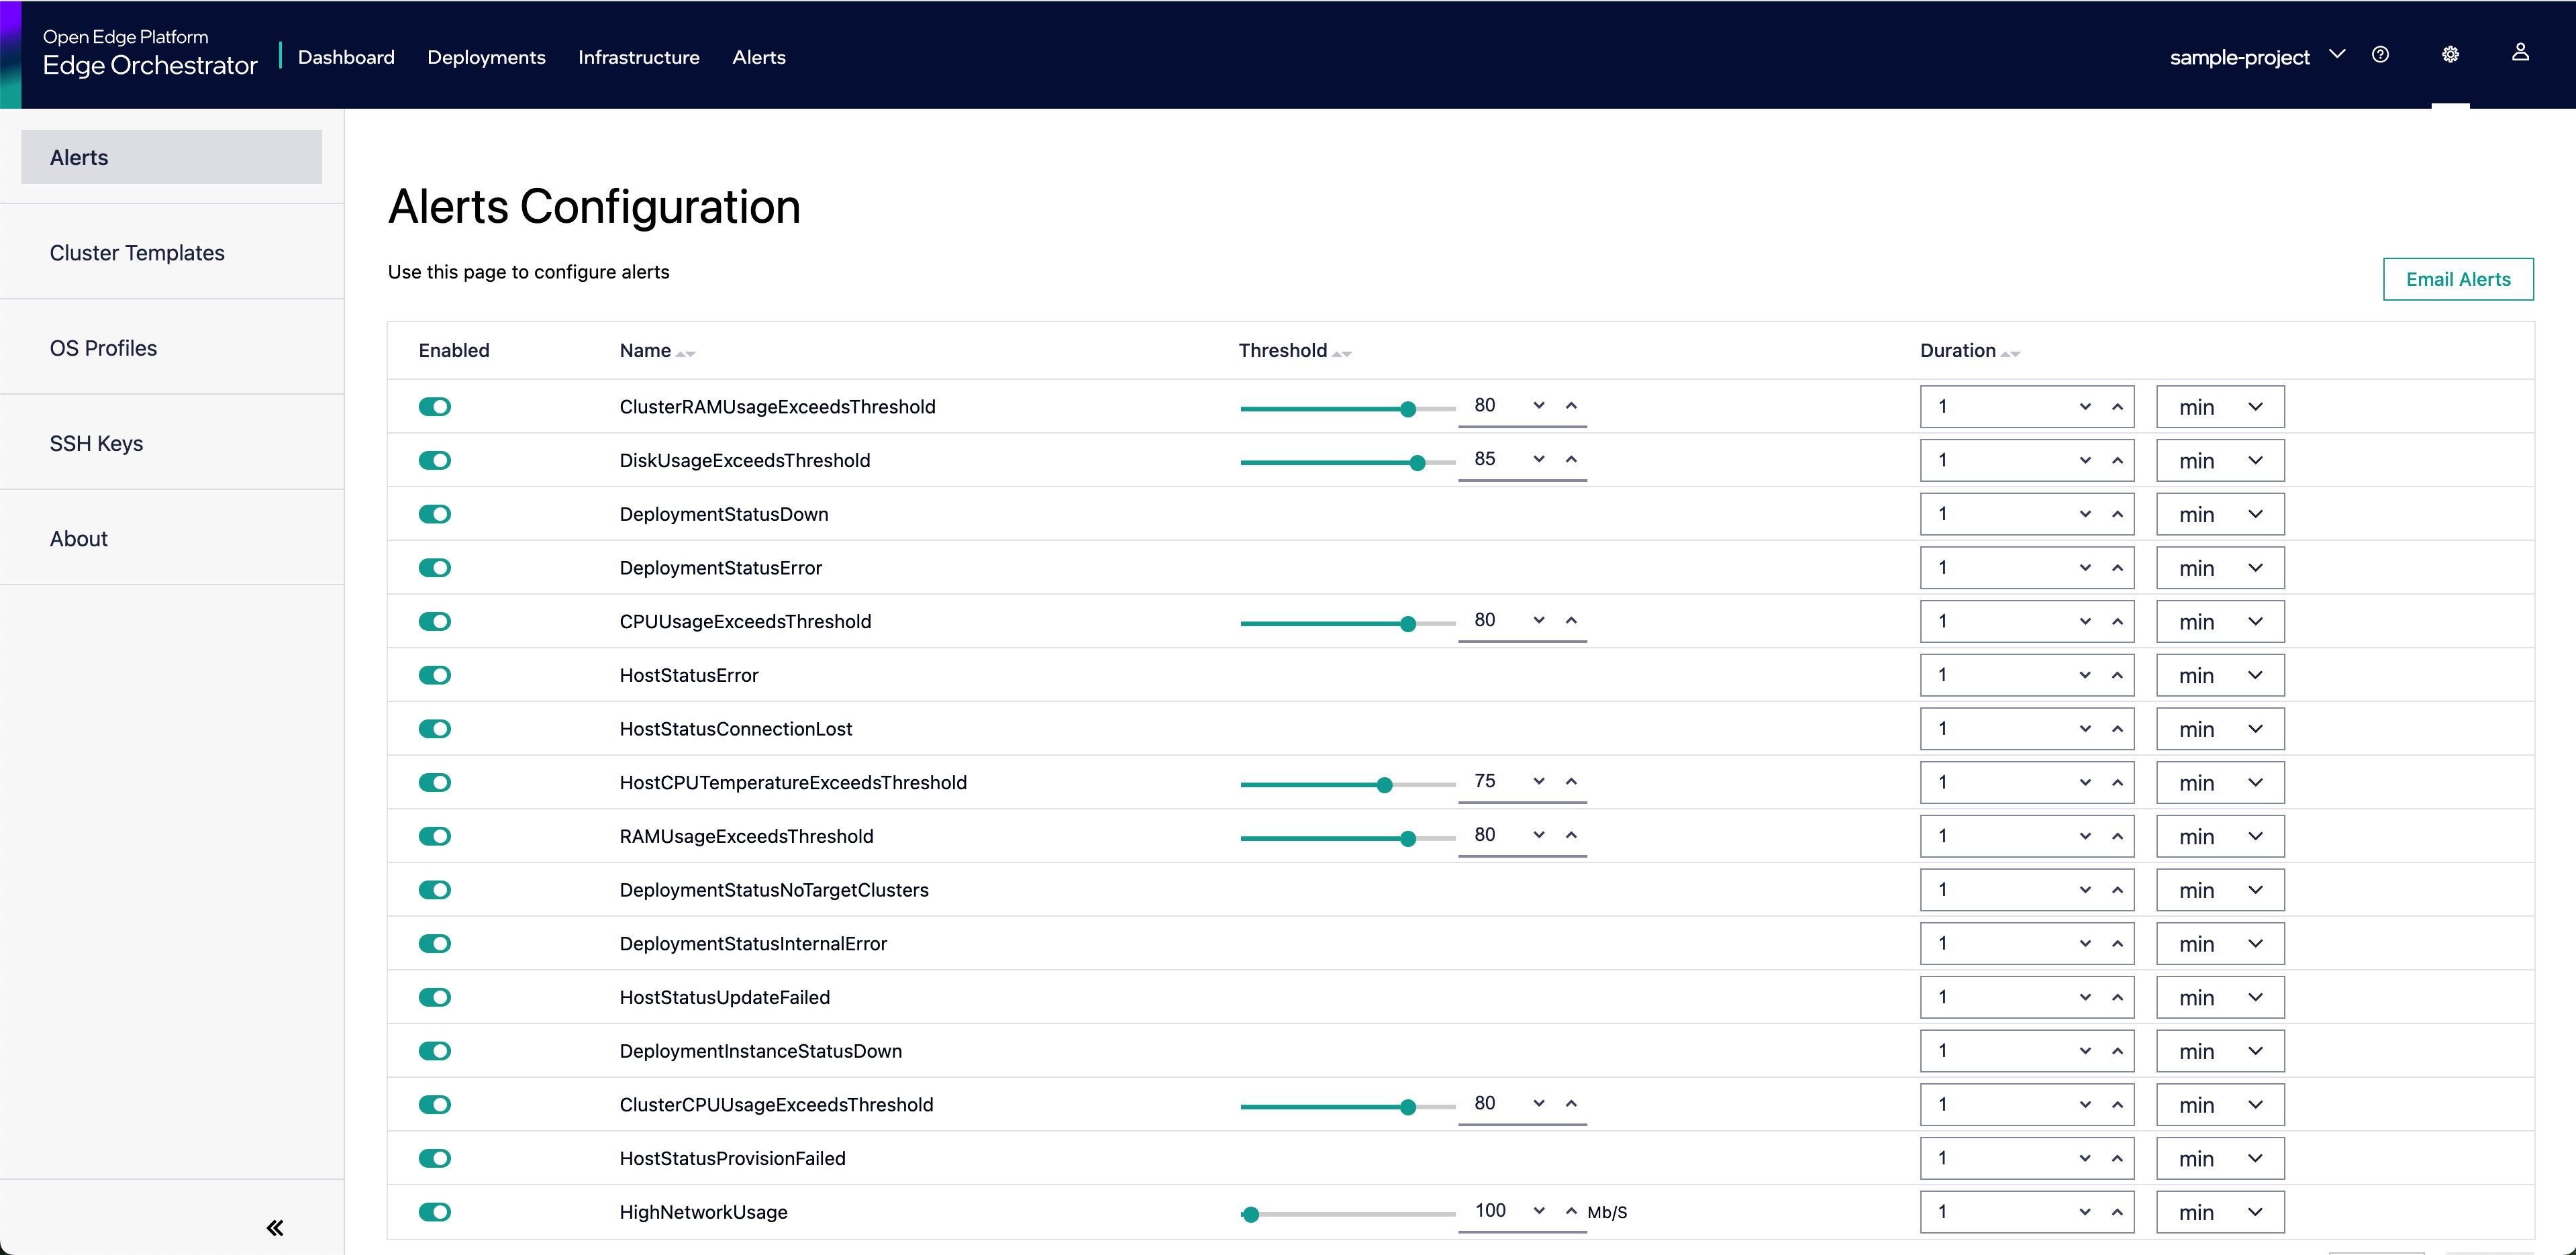
User Interface (UI)#
The User Interface (UI) provides support for configuring alerts under the Settings tab (gear icon in the top right corner of the UI). The UI allows users to configure thresholds and durations for alerts, as well as the email addresses to which alerts should be sent.
It also provides a view of the alerts that have been reported by the system.