Performance#
In general, the performance of the Edge Manageability Framework and all of it’s microservices can be monitored using the Prometheus* and Grafana* stack in the Observability user interface Edge Manageability Framework Edge Orchestrator Cluster Dashboard.
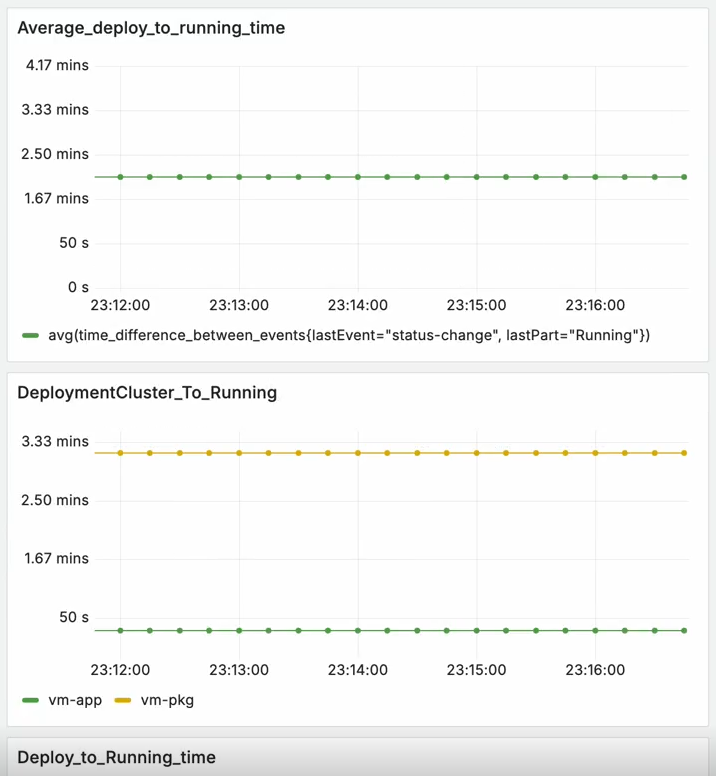
For more specific metrics on the Application Deployment manager, a dashboard is available in GitHub at open-edge-platform/app-orch-deployment that can be imported into Grafana* to monitor the performance of the Application Deployment Manager.
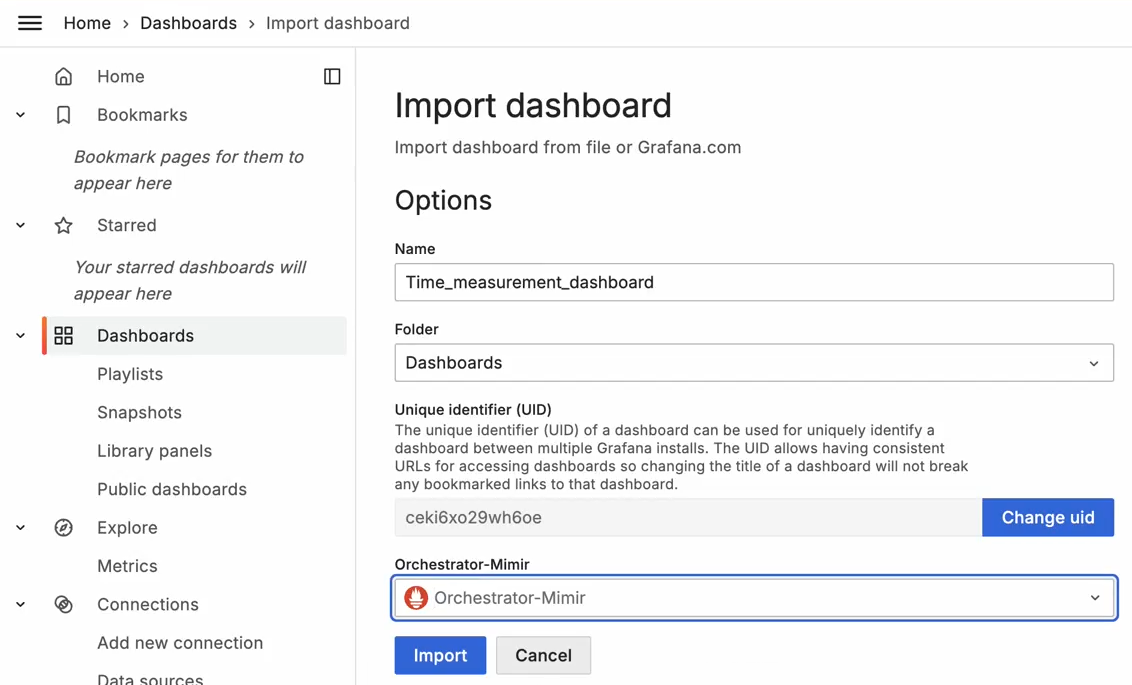
The usual Grafana controls apply to this dashboard, allowing you to filter by time range, and monitoring the performance while applications are actively deployed.
A further explanation of the metrics are available in open-edge-platform/orch-library.