Edge Node Reporting Agent#
Background#
This document provides high-level design and implementation guidelines. Refer to Reporting Agent in the Edge Node Agents’ GitHub* repository for implementation details.
Target Audience#
The target audience for this document is:
Developers interested in contributing to the implementation of the Reporting Agent.
Administrators and System Architects interested in the architecture, design, and functionality of the Reporting Agent.
Overview#
The Reporting Agent is responsible for collecting a comprehensive set of metrics and system information from Open Edge Platform installations. It gathers data from a variety of sources to provide a detailed snapshot of the system’s hardware, software, and runtime environment.
While it resembles the Hardware Discovery Agent, the Reporting Agent is a separate CLI application that is independent of the Edge Orchestrator’s Edge Infrastructure Manager (EIM).
Architecture Diagram#
The Reporting Agent is a small footprint binary deployed on the Edge Nodes that collects and sends the data about underlying hardware, operating system, and about applications running on Kubernetes cluster.
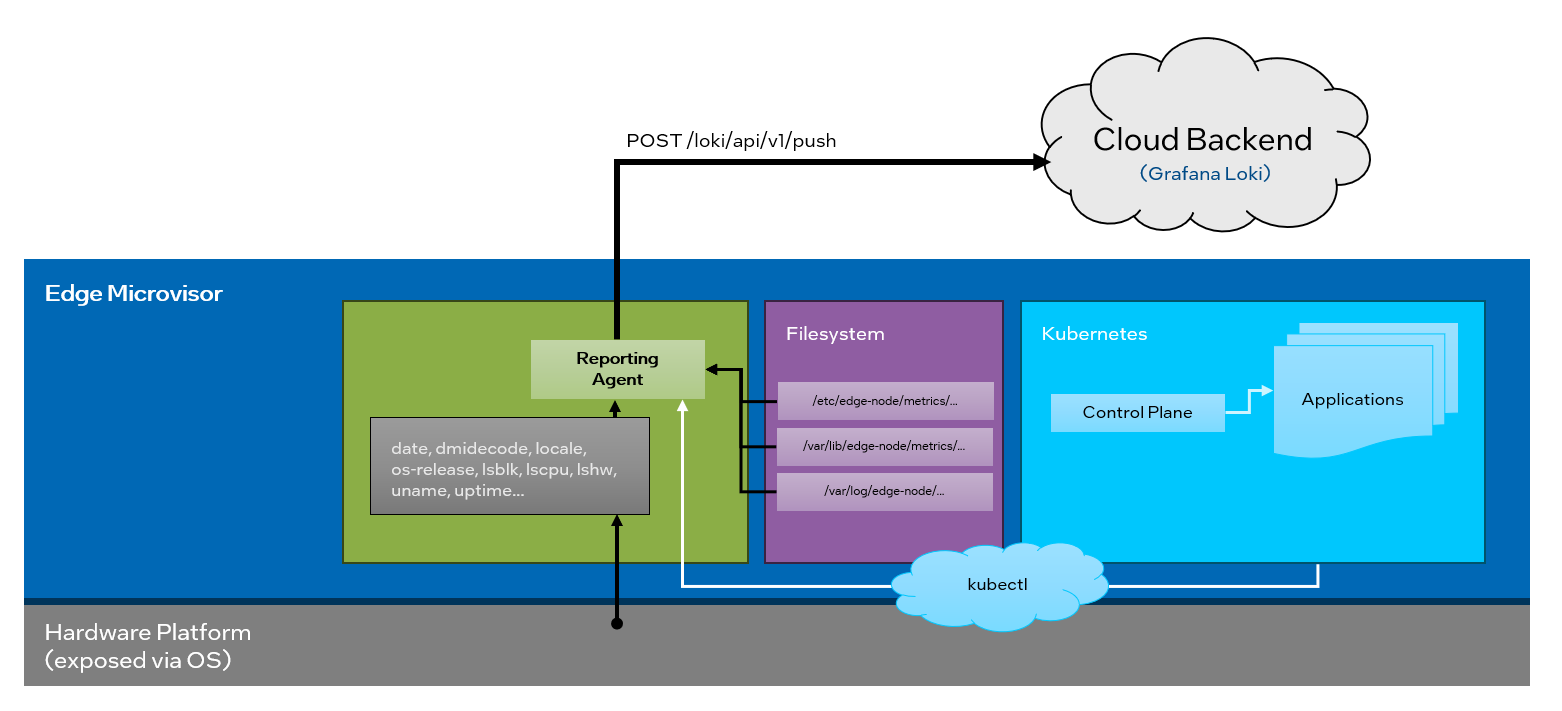
Figure 1: High-Level Architecture of the Reporting Agent#
Key Assumptions#
The Reporting Agent follows the general principles of Open Edge Platform’s Edge Node Agents but introduces few unique features.
- Requires configuration settings to be provided during Edge Node installation. Absence of any of the following will prevent Agent from sending any data:
/etc/edge-node/metrics/endpoint- shall contain target endpoint to send data to/etc/edge-node/metrics/token- shall contain access token to authenticate with the target endpoint/etc/edge-node/metrics/group_id- shall contain group identifier to which the Edge Node belongs
- Pushes data to Cloud Backend:
Invokes HTTP POST with
ContentType: application/jsonusing Grafana Loki* Data FormatTarget tenant in Grafana Loki* is set using
X-Scope-OrgID=reporting-v1Upon failure the request is retried
20times with exponential backoff
- Stores its logs on the Edge Node with time-based data retention:
Agent’s logs are rotated with default
90dretentionLogs location:
/var/log/edge-node/reporting.log
- Captures and stores Audit logs on the Edge Node with time-based data retention:
Every JSON payload that is shipped to the cloud backend is logged
Audit logs are rotated with default
90dretentionLocated in
/var/log/edge-node/reporting-audit.log
Extensibility#
The Reporting Agent functionality can be extended by making source code changes.
Deployment#
Reporting Agent is a CLI application that can be executed manually or automatically,
via cron job defined as part of Edge Microvisor:
crontabentries location:/etc/cron.d/edge-node-metricsis executed only if
/etc/edge-node/metrics/disabledis not set- if enabled the Reporting Agent is invoked:
on every reboot (
@reboot) with full system informationperiodically (every
1h) with data set reduced to application data
Default cron configuration is stored in SPEC definition for Reporting Agent.
Data Collected#
System Data#
Reporting Agent queries system data grouped in following sets:
Identity- for identification of a given Edge Node a combination of multiple identifiers is used to maximize uniqueness.MachineIdis asha256hash generated with each data collection from concatenated string values of:System UUID
sudo dmidecode -s system-uuidSystem Serial
sudo dmidecode -s system-serial-numberNetwork Cards MAC addresses
sudo lshw -class network | grep -i "serial:"(sorted ascending)
InitialMachineId- provides means to detect hardware changes during Edge Node lifetime and allow more precise querying. It contains a copy of the firstMachineIdcalculation stored in/etc/edge-node/metrics/machine_id.GroupId- contains/etc/edge-node/metrics/group_idvalue supplied during installation of the Edge Node.
OperatingSystem- contains details of the currently running OS:Timezone
date +%ZLocale
locale -k LC_ADDRESS(country_name, country_ab2, lang_name, lang_ab)uptime seconds
/proc/uptime(first value)- Kernel data
machine (
uname -m),name (
uname -s),release (
uname -r),version (
uname -v),system (
uname -o)
- OS Release data (from
/etc/os-release) ID,
VERSION_ID,
VERSION,
VERSION_CODENAME,
ID_LIKE,
BUILD_ID,
IMAGE_ID,
IMAGE_VERSION
- OS Release data (from
ComputerSystem- contains hardware information- CPU data from following fields from
lscpuoutput: Architecture,
Vendor,
Family,
ModelName,
Model,
Stepping,
SocketCount,
CoreCount,
ThreadCount,
VirtualizationType,
Hypervisor
- CPU data from following fields from
- Memory data from
dmidecode --type memory(ordmidecode --type 17) - Summary (aggregated values)
total size of all devices (in MB)
common type (only if equal for all devices) e.g.:
DDR5common form factor (only if equal for all devices) e.g.:
DIMM
- Individual devices (for populated banks only)
FormFactor,
Type,
Size,
Speed,
Manufacturer
- Memory data from
- Disk data from
lsblk -o KNAME,VENDOR,MODEL,SIZE,TYPE -J -b --tree filtered, only
"type": "disk"
- Disk data from
Kubernetes applications#
If the Edge Node has a Kubernetes cluster populated, the Agent collects information about running applications via kubectl command.
Supported Kubernetes clusters include k3s and RKE2 installations.
- Default
RKE2cluster configuration and binary locations: > export KUBECONFIG=/etc/rancher/rke2/rke2.yaml > /var/lib/rancher/rke2/bin/kubectl get nodes
- Default
- Default
k3scluster configuration and binary locations:: > export KUBECONFIG=/etc/rancher/k3s/k3s.yaml > /var/lib/rancher/k3s/bin/kubectl get nodes
- Default
Applications running on the cluster are identified by reading the following labels:
- Intel specific labels populated by applications fully supporting Open Edge Platform:
com.intel.edgeplatform.application.namecom.intel.edgeplatform.application.version
- Default well-known Kubernetes labels:
app.kubernetes.io/nameapp.kubernetes.io/versionapp.kubernetes.io/part-of
Note
Only a set of unique values representing detected applications is exported. For applications containing Intel specific labels the default well-known Kubernetes labels are also sent.
Reporting Agent queries Kubernetes application data grouped into the following sets:
Kubernetesdata fromkubectlserver vendor
server version
running applications (as unique label sets)
Security#
The endpoint specified in the /etc/edge-node/metrics/endpoint file must use the https protocol.
To authenticate with the backend, the application requires a HTTP BasicAuth user and password,
which must be provided in the /etc/edge-node/metrics/token file in the format username:password.
TLS version 1.3 is used for backend communication if supported by the server; otherwise, TLS 1.2 is used.
The user running the application should be added to the sudoers file,
as the dmidecode and lshw applications require such privileges.
The same user must also have execute access to the kubectl binary and read access to the kubeconfig file.
The paths to these files are specified in the reporting-agent.yaml configuration file.
Auditing#
Reporting Agent provides auditing capabilities by logging every JSON payload that is sent to the cloud backend in addition to its regular logs. Both are rotated with a default retention of 90 days.
Regular logs location:
/var/log/edge-node/reporting.logAudit logs location:
/var/log/edge-node/reporting-audit.log