Edge Node Platform Observability Agent#
Background#
This document provides high-level design and implementation guidelines. Refer to Platform Observability Agent in the Edge Node Agents GitHub* repository for implementation details.
Target Audience#
The target audience for this document includes:
Developers interested in contributing to the implementation of the Platform Observability Agent.
Administrators and System Architects interested in the architecture, design and functionality of the Platform Observability Agent.
Overview#
Platform Observability Agent is part of the Open Edge Platform’s Edge Node Zero Touch Provisioning. It is installed, configured and automatically executed at Provisioning time.
The Platform Observability Agent is a set of four observability agents deployed as individual systemd services alongside the other Edge Node Agents on the Edge Node. These services are:
platform-observability-logging, which is a FluentBit* service for scraping logs from all Edge Node Agents except health check logs.
platform-observability-health-check, which is a FluentBit service for scraping health check logs from Edge Node Agents.
platform-observability-metrics, which is a Telegraf* service for scraping metrics from the Edge Node Agents as well as from the Edge Node HW.
platform-observability-collector, which is a OpenTelemetry* Collector service for gathering and forwarding all logs and hardware metrics to the Edge Orchestrator.
Architecture Diagram#
The Platform Observability Agent follows the architecture and design principles set out in High-Level Architecture

Figure 1: High-Level Architecture of Platform Observability Agent#
Key Components#
The Platform Observability Agent is a system daemon packaged as a .deb or .rpm package (depending on target Operating System).
The Platform Observability Agent requires a designated JWT token
FluentBit service with config at
/etc/fluent-bit/fluent-bit.confHealth check service with config at
/etc/health-check/health-check.confTelegraf service with config at
/etc/telegraf/telegraf.d/telegraf.confOpenTelemetry service with config at
/etc/otelcol/otelcol.yaml
Data Flow#
The data flow of the Platform Observability Agent can be broken down into multiple concepts called out in the Workflow Stages section.
Workflow Stages#
Log Collection configuration:
- FluentBit configuration for platform-observability-logging
- Inputs
systemd input plugin configured to capture Kubernetes Engine service logs
systemd input plugin configured to capture hardware-discovery-agent service logs
systemd input plugin configured to capture cluster-agent service logs
systemd input plugin configured to capture node-agent service logs
systemd input plugin configured to capture platform-telemetry-agent service logs
systemd input plugin configured to capture platform-update-agent service logs
Tail input plugin configured to capture INBC logs from /var/lib/dispatcher/upload/*
systemd input plugin configured to capture RKE-server service logs
systemd input plugin configured to capture RKE-system-agent service logs
systemd input plugin configured to capture platform-observability-metrics service logs
systemd input plugin configured to capture platform-observability-collector service logs
- Outputs
Forward output plugin configured to send logs to the log socket file provided by the OpenTelemetry Collector service.
- Options
Buffering using host file system enabled
- Fluent Bit configuration for platform-observability-health-check
- Inputs
Exec input plugin configured to capture Kubernetes Engine service status
Exec input plugin configured to capture hardware-discovery-agent service status
Exec input plugin configured to capture cluster-agent service status
Exec input plugin configured to capture node-agent service status
Exec input plugin configured to capture platform-telemetry-agent service status
Exec input plugin configured to capture platform-update-agent service status
Exec input plugin configured to capture RKE-server service status
Exec input plugin configured to capture RKE-system-agent service status
- Outputs
Forward output plugin configured to send logs to the log socket file provided by the OpenTelemetry Collector service.
Options
Buffering using host file system enabled
- OpenTelemetry Collector configuration
- Receivers
Fluentforward input plugin configured to receive logs from the platform-observability-logging systemd service.
Fluentforward input plugin configured to receive system logs from the cluster fluent bit service.
Fluentforward input plugin configured to receive application logs from the cluster fluent bit service.
Fluentforward input plugin configured to receive container logs from the cluster fluent bit service.
Processors - Memory limiter processor plugin configures the maximum memory usage for the collector service.
Batch processor plugin configures the settings for batching received logs in the collector before sending.
Attributes processor plugin applies the edge node UUID as a tag onto the logs before the collector sends them to Edge Manageability Framework.
Exporters
Otlphttp exporter plugin configured to send platform-observability-logging service logs to Edge Manageability Framework log endpoint.
Otlphttp exporter plugin configured to send system logs from the cluster
fluentbitservice to Edge Manageability Framework log endpoint.Otlphttp exporter plugin configured to send application logs from the cluster
fluentbitservice to Edge Manageability Framework log endpoint.Otlphttp exporter plugin configured to send container logs from the cluster
fluentbitservice to Edge Manageability Framework log endpoint.
- Extensions
Bearer token authentication extension plugin applies the JWT token as a HTTP header to the collector output to Edge Manageability Framework.
        flowchart TD
   I1[KE service] -->|logs| Collector
   I2[Hardware Discovery Agent] -->|logs| Collector
   I3[Cluster Agent] -->|logs| Collector
   I4[Node Agent] -->|logs| Collector
   I5[Vault Agent] -->|logs| Collector
   I6[Platform Update Agent] -->|logs| Collector
   I7[INBC] -->|logs| Collector
   I8[RKE System Agent] -->|logs| Collector
   I9[RKE Server] -->|logs| Collector
   I10[Telegraf] -->|logs| Collector
   I11[Otel Collector] -->|logs| Collector
   I12[Telemetry Agent] -->|logs| Collector
   I13[AppArmour] -->|logs| Collector
   I14[Process] -->|logs| Collector
   I15[EN Users] -->|logs| Collector
   I16[Firewall] -->|logs| Collector
   I17[Host] -->|logs| Collector
   I18[OS] -->|logs| Collector
   Collector --> Routing
   Routing --> Orchestrator
Figure 2: Log Collection configuration
Metrics Collection configuration:
- Telegraf configuration
- Inputs
System input plugin enables gathering of system related metrics from the HW, including how long it has been running for since the last power off.
CPU input plugin enables gathering of CPU related metrics from the HW.
Linux CPU input plugin enables gathering of Linux CPU related metrics from the HW.
Memory input plugin enables gathering of memory related metrics from the HW.
Disk input plugin enables gathering of disk related metrics from the HW.
Disk IO input plugin enables gathering of diskio related metrics from the HW.
Net input plugin enables gathering of network related metrics from the HW.
Temp input plugin enables gathering of temperature related metrics from the HW.
IPMI sensor input plugin enables gathering of IPMI related metrics from the HW using the
ipmitool. Disabled by default.SMART input plugin enables gathering of storage device related metrics from the HW using
smartctl. Disabled by default.Intel powerstat input plugin enables gathering of power related metrics from Intel based platforms. Disabled by default.
Intel PMU input plugin enables gathering of performance related metrics from the Intel Performance Monitoring Unit (PMU) using the
Linux Perfsubsystem. Disabled by default.Intel RDT input plugin enables gathering of shared resource metrics from the HW using the Intel Resource Director Technology framework.
Intel PMT input plugin enables gathering of system metrics from the HW using the Linux kernel driver for Intel Platform Montoring Technology (PMT). Disabled by default.
LVM input plugin enables gathering of
physical volume, volume group and logical
group
metrics from the Logical Volume Management (LVM) service in the kernel. Disabled by default.Telegraf exec input plugin enables gathering of metrics from system commands using shell scripts. In the agent, this includes dGPU, iGPU, NPU, disk, BIOS and hyper threading metrics. Disabled by default except for disk and BIOS metrics.
Ethtool input plugin enables gathering of Ethernet device metrics from the HW. Disabled by default.
RAS input plugin enables gathering of error metrics from the RASDaemon in the HW. Disabled by default.
Redfish input plugin enables gathering of status information from the HW when DMTF Redfish support is enabled. Disabled by default.
- Outputs
OpenTelemetry output plugin configured to send metrics to the metrics socket file provided by the OpenTelemetry Collector service.
- OpenTelemetery Collector configuration
- Receivers
Otlp input plugin configured to receive HW metrics from Telegraf as well as metrics from the Edge Node Agents.
- Processors
Memory limiter processor plugin configures the maximum memory usage for the collector service.
Batch processor plugin configures the settings for batching received metrics in the collector before sending.
Attributes processor plugin applies the edge node UUID as a tag onto the metrics before the collector sends them to Edge Manageability Framework.
Exporters
Otlphttp exporter plugin configured to send metrics to Edge Manageability Framework metrics endpoint.
- Extensions
Bearer token authentication extension plugin applies the JWT token as a HTTP header to the collector output to Orchestrator.
        flowchart TD
   I1[Telegraf] -->|metrics| Collector
   I2[Node Agent] -->|metrics| Collector
   I3[Cluster Agent] -->|metrics| Collector
   I4[Hardware Agent] -->|metrics| Collector
   I5[Platform Update Agent] -->|metrics| Collector
   Collector --> Routing
   Routing --> Orchestrator
Figure 3: Metrics Collection configuration
Extensibility#
The Platform Observability Agent functionality can be extended by making source code changes.
Deployment#
The Platform Observability Agent is deployed as a set of system daemons via installation of a .deb package during the provisioning or .rpm package as part of the Edge Microvisor Toolkit.
The Platform Observability Agent installs four services, platform-observability-logging, platform-observability-health-check, platform-observability-metrics and platform-observability-collector, when deployed on to the Edge Node.
Each service file is stored in the /lib/systemd/system/ folder as <service_name>.service.
The config file for the platform-observability-logging service is stored in
/etc/fluent-bit/fluent-bit.conf.
The config file for the platform-observability-health-check service is stored
in /etc/health-check/health-check.conf.
The config file for the platform-observability-metrics service is stored in
/etc/telegraf/telegraf.conf.
The config file for the platform-observability-collector service is stored in
/etc/otelcol/otelcol.yaml.
Logs for each service can be viewed using the journalctl tool.
Technology Stack#
Below sections provide an overview of various aspects of the Platform Observability Agent’s technology stack.
Implementation#
The Platform Observability Agent is implemented as a set of observability services configured for collection of desired logs and metrics.
System Diagram#
Platform Observability Agent depends on Edge Manageability Framework endpoints:
Edge Manageability Framework central log collector service endpoint.
Edge Manageability Framework central metrics collector service endpoint.
Platform Observability Agent external telemetry collectors:
Official fluent-bit Debian package.
Official telegraf Debian package.
Official Otel Collector Debian package.
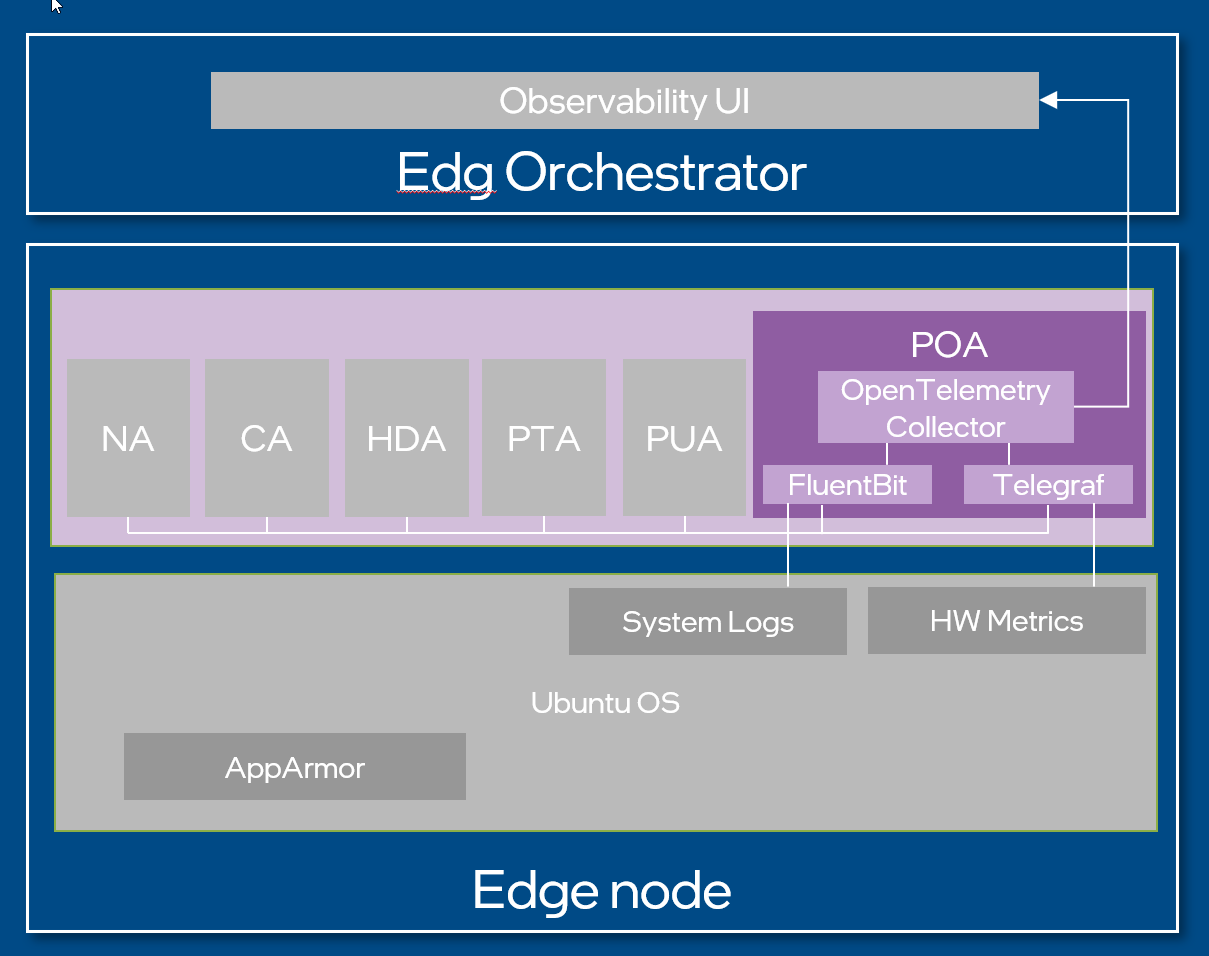
Figure 4: Platform Observability Agent system diagram#
Integrations#
Platform Observability Agent does not expose an API, it exposes metrics to the endpoints of the Edge Manageability Framework.
Platform Observability Agent integrates the 3rd party metric collectors - FluentBit, Telegraf, OpenTelemetry collector.
Security#
Security Policies#
Platform Observability Agent adheres to Edge Node Agents High-Level Architecture security design principle.
Auditing#
Platform Observability Agent adheres to Edge Node Agents High-Level Architecture observability design principle.
Upgrades#
Platform Observability Agent adheres to Edge Node Agents High-Level Architecture upgrade design principle.