View Open Telemetry Data#
DL Streamer Pipeline Server supports gathering metrics over Open Telemetry. The supported metrics currently are:
cpu_usage_percentage: Tracks CPU usage percentage of DL Streamer Pipeline Server python processmemory_usage_bytes: Tracks memory usage in bytes of DL Streamer Pipeline Server python processfps_per_pipeline: Tracks FPS for each active pipeline instance in DL Streamer Pipeline ServerOpen
https://<HOST_IP>/prometheusin your browser to view the prometheus console and try out the below queries:Note: If you’re running multiple instances of app, ensure to provide
NGINX_HTTPS_PORTnumber in the url for the app instance i.e. replace<HOST_IP>with<HOST_IP>:<NGINX_HTTPS_PORT>If you’re running a single instance and using anNGINX_HTTPS_PORTother than the default 443, replace<HOST_IP>with<HOST_IP>:<NGINX_HTTPS_PORT>cpu_usage_percentagememory_usage_bytesfps_per_pipeline{}If you are starting multiple pipelines, then it can also be queried per pipeline ID. Example:
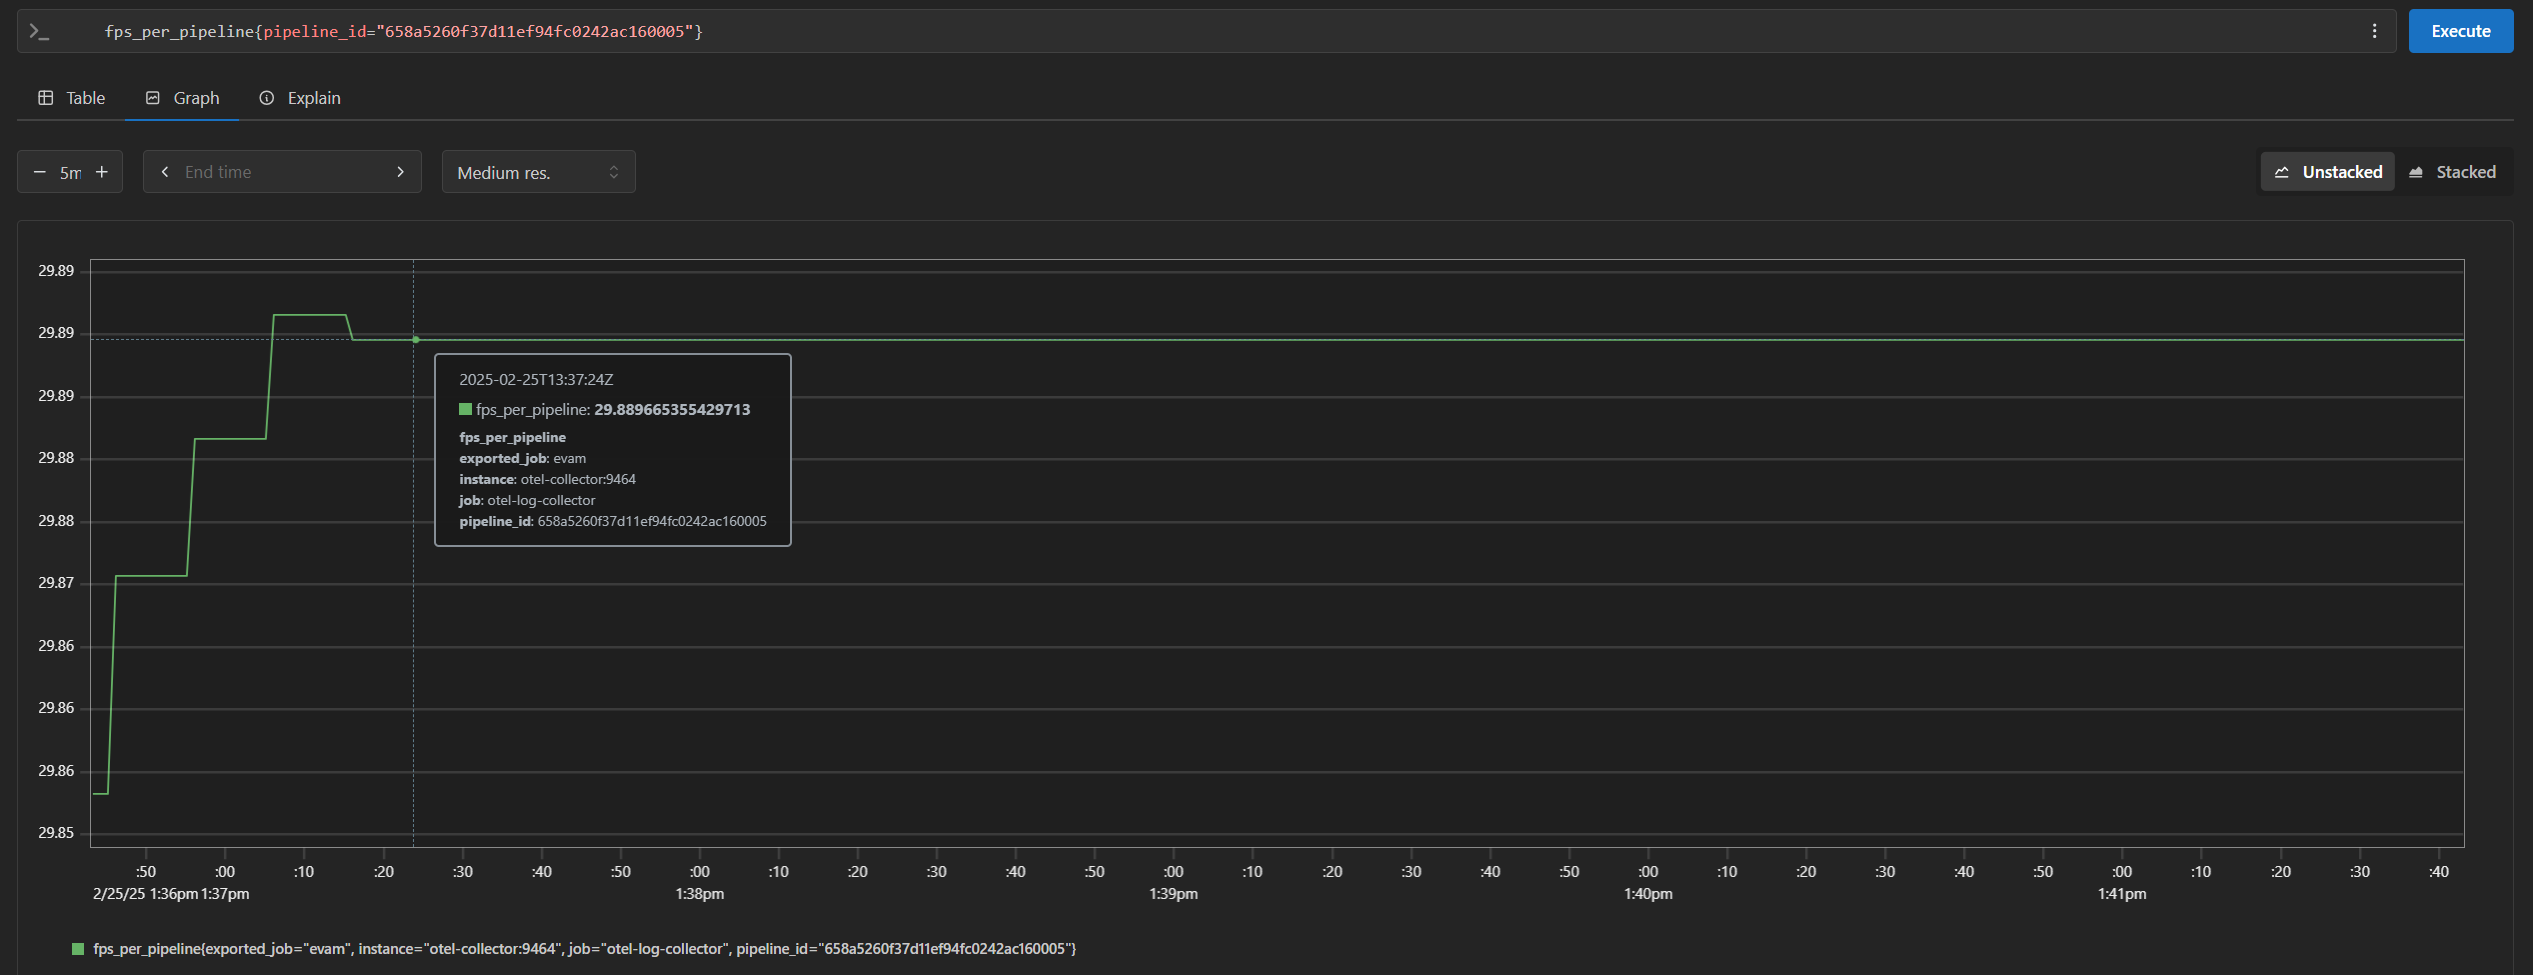
fps_per_pipeline{pipeline_id="658a5260f37d11ef94fc0242ac160005"}
End the demonstration#
Follow this procedure to stop the sample application and end this demonstration.
Stop the sample application with the following command.
If you’re running multiple instances of app, stop the services using
./run.sh downinstead.docker compose down -v
Confirm the containers are no longer running.
docker ps