Enable System Metrics Dashboard#
Note: The system metrics dashboard is only supported with docker compose deployments and requires
Telegrafto run as therootuser. Verified only forWind Turbine Anomaly Detectionsample app.
Follow the prerequisites and ensure you understand the data flow explanation.
To enable the system metrics dashboard showcasing the CPU, memory, network, disk IO usage for the host and docker containers, run the following command:
cd edge-ai-suites/manufacturing-ai-suite/industrial-edge-insights-time-series/ # path relative to git clone folder
# Try one of the below options:
make up_opcua_ingestion INCLUDE=validation
# OR
make up_mqtt_ingestion INCLUDE=validation
Viewing System Metrics Dashboard#
Use link
https://<host_ip>:3000/to launch Grafana from browser (preferably Chrome browser)Login to the Grafana with values set for
VISUALIZER_GRAFANA_USERandVISUALIZER_GRAFANA_PASSWORDin.envfile and select System Metrics Dashboard.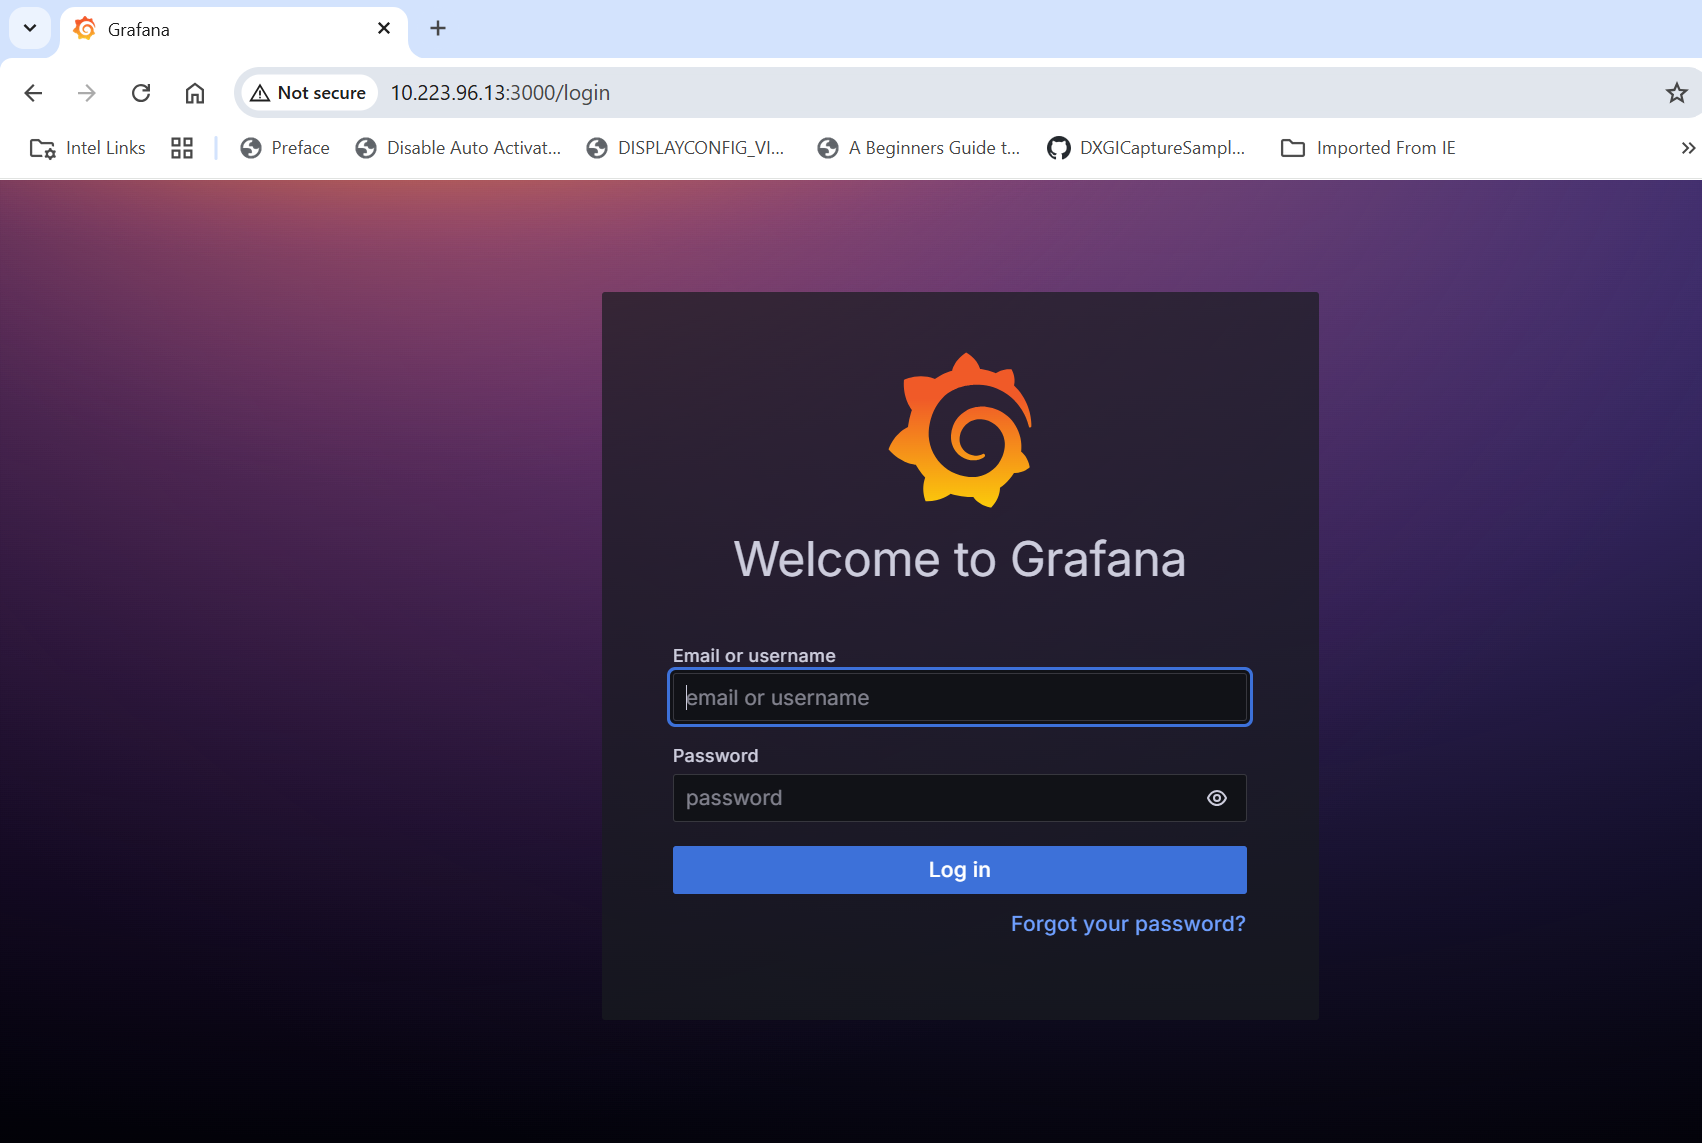
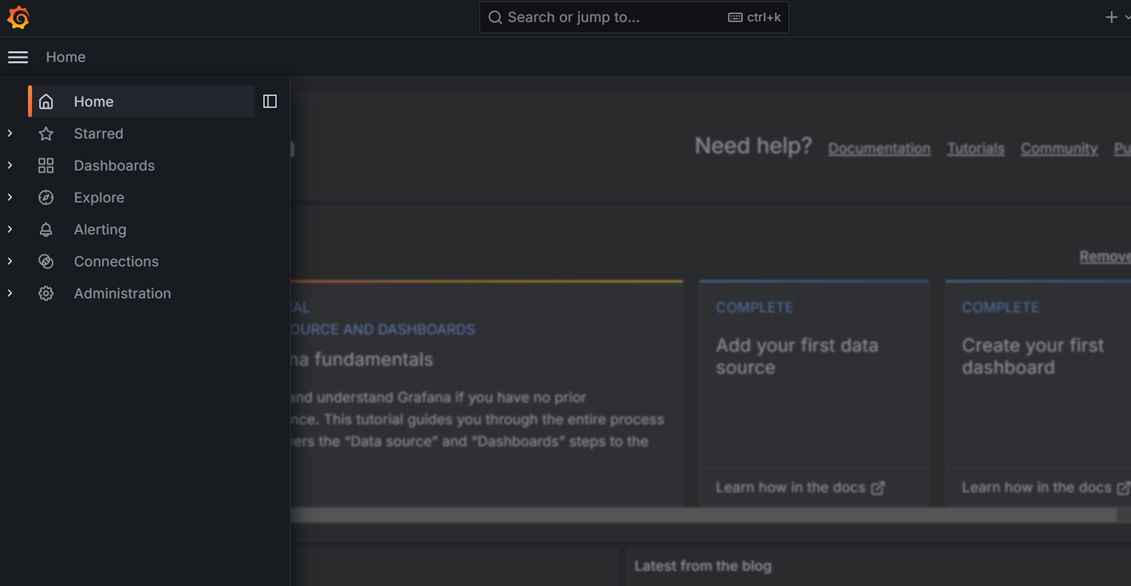
After login, click on Dashboard
Select the
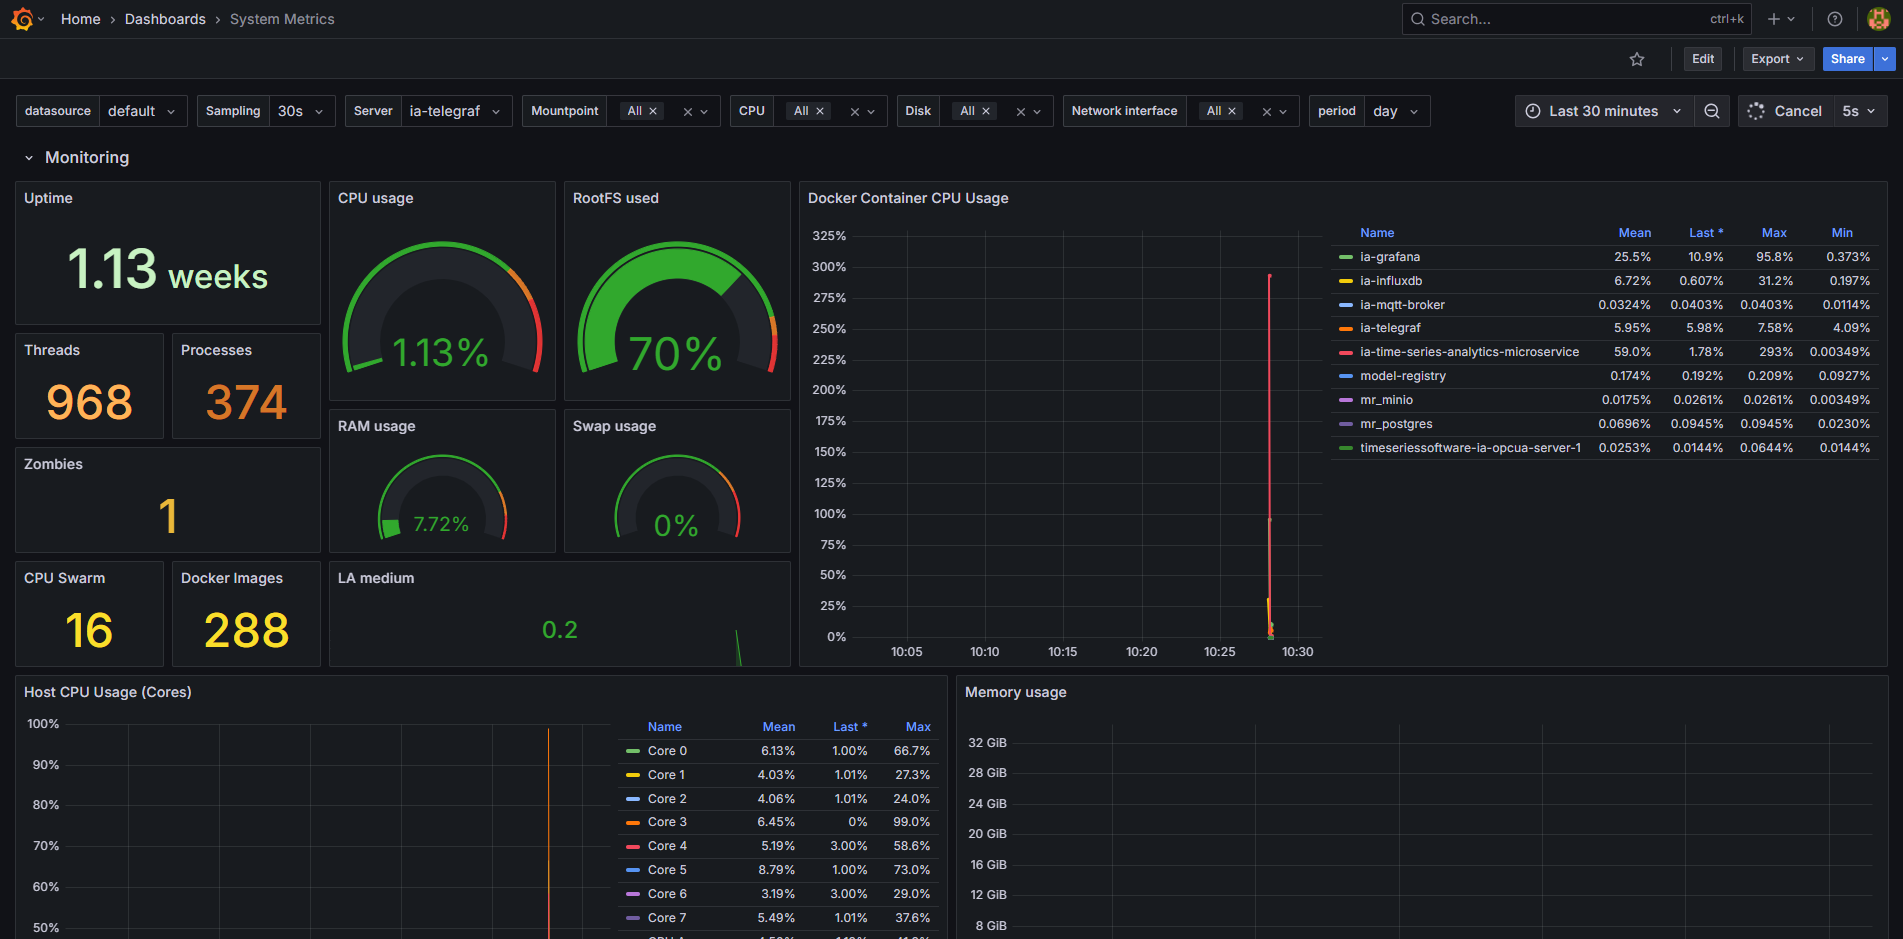
System Metrics Dashboard.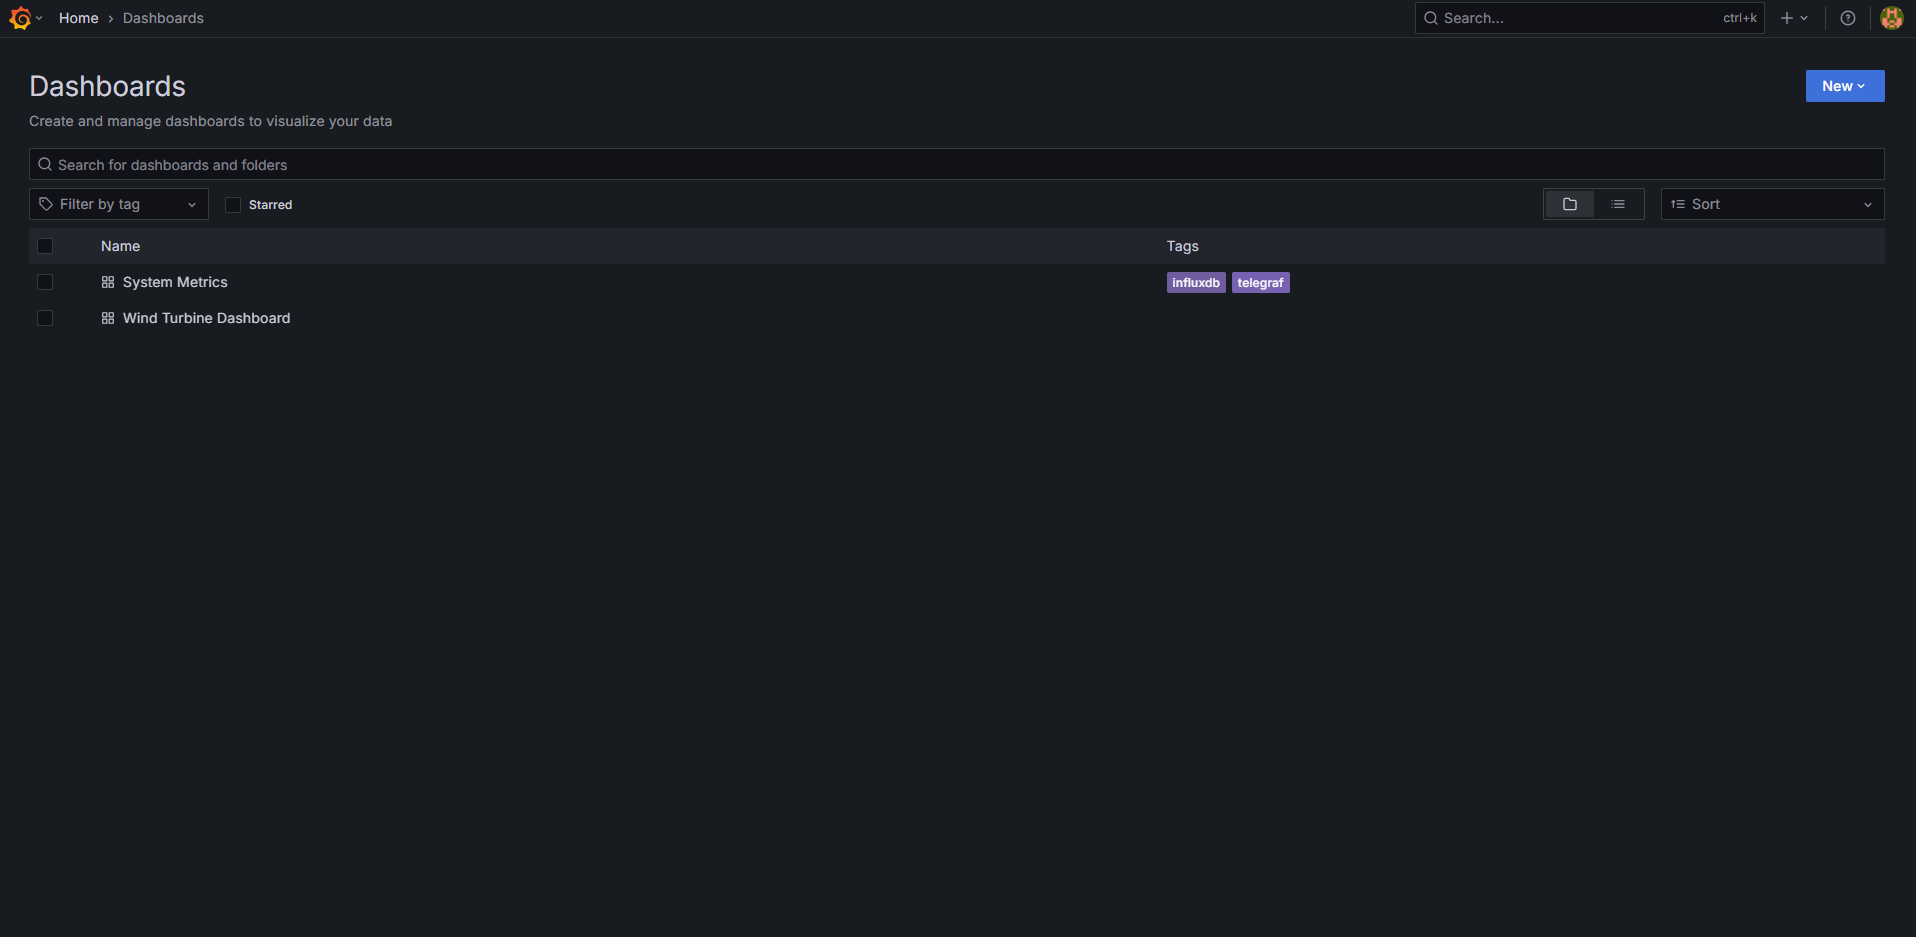
One will see the below output.