Get Started#
Time to Complete: 30 minutes
Programming Language: Python 3
Configure Docker#
To configure Docker:
Run Docker as Non-Root: Follow the steps in Manage Docker as a non-root user.
Configure Proxy (if required):
Set up proxy settings for Docker client and containers as described in Docker Proxy Configuration.
Example
~/.docker/config.json:{ "proxies": { "default": { "httpProxy": "http://<proxy_server>:<proxy_port>", "httpsProxy": "http://<proxy_server>:<proxy_port>", "noProxy": "127.0.0.1,localhost" } } }
Configure the Docker daemon proxy as per Systemd Unit File.
Enable Log Rotation:
Add the following configuration to
/etc/docker/daemon.json:{ "log-driver": "json-file", "log-opts": { "max-size": "10m", "max-file": "5" } }
Reload and restart Docker:
sudo systemctl daemon-reload
sudo systemctl restart docker
Clone source code#
Go to the target directory of your choice and clone the suite.
If you want to clone a specific release branch, replace main with the desired tag.
To learn more on partial cloning, check the Repository Cloning guide.
git clone --filter=blob:none --sparse --branch main https://github.com/open-edge-platform/edge-ai-suites.git
cd edge-ai-suites
git sparse-checkout set manufacturing-ai-suite
cd manufacturing-ai-suite/industrial-edge-insights-multimodal
Deploy with Docker Compose#
Update the following fields in
.env.INFLUXDB_USERNAMEINFLUXDB_PASSWORDVISUALIZER_GRAFANA_USERVISUALIZER_GRAFANA_PASSWORDMTX_WEBRTCICESERVERS2_0_USERNAMEMTX_WEBRTCICESERVERS2_0_PASSWORDHOST_IPS3_STORAGE_USERNAMES3_STORAGE_PASSWORD
Deploy the sample app, use only one of the following options.
NOTE:
The below
make upfails if the above required fields are not populated as per the rules called out in.envfile.The sample app is deployed by pulling the pre-built container images of the sample app from the docker hub OR from the internal container registry (login to the docker registry from cli and configure
DOCKER_REGISTRYenv variable in.envfile atedge-ai-suites/manufacturing-ai-suite/industrial-edge-insights-multimodal)The
CONTINUOUS_SIMULATOR_INGESTIONvariable in the.envfile (for Docker Compose) is set totrueby default, enabling continuous looping of simulator data. To ingest the simulator data only once (without looping), set this variable tofalse.The update rate of the graph and table may lag by a few seconds and might not perfectly align with the video stream, since Grafana’s minimum refresh interval is 5 seconds.
The graph and table may initially display “No Data” because the Time Series Analytics Microservice requires some time to install its dependency packages before it can start running.
Fusion Analytics starts once the RTP sender timestamp is available in the metadata packet from the DL Streamer Pipeline Server.
Known issue: DL Streamer Pipeline Server may not send RTP sender timestamps for the first ~300 packets. This may result in a delay before Fusion Analytics becomes fully operational.
cd edge-ai-suites/manufacturing-ai-suite/industrial-edge-insights-multimodal
make up
Use the following command to verify that all containers are active and error-free.
Note: The command
make statusmay show errors in containers like ia-grafana when the user has not logged in for the first login OR due to session timeout. Just login again in Grafana and functionality wise if things are working, then ignoreuser token not founderrors along with other minor errors which may show up in Grafana logs.cd edge-ai-suites/manufacturing-ai-suite/industrial-edge-insights-multimodal make status
Running Time Series Analytics Microservice User Defined Function(UDF) inference on GPU#
By default, UDF for Time Series Analytics Microservice is configured to run on CPU.
To trigger the UDF inference on GPU in Time Series Analytics Microservice, run the following command:
cd edge-ai-suites/manufacturing-ai-suite/industrial-edge-insights-multimodal/configs/time-series-analytics-microservice
curl -k -X 'POST' \
 'https://localhost:3000/ts-api/config' \
 -H 'accept: application/json' \
 -H 'Content-Type: application/json' \
 -d "$(sed 's/"device": "CPU"/"device": "GPU"/' config.json)"
Running DL Streamer Pipeline Server model inference on GPU or NPU#
By default, model for DL Streamer Pipeline Server is configured to run on CPU.
To trigger the model inference on GPU in DL Streamer Pipeline Server, run the following command:
To run inference on with GPU,
cd edge-ai-suites/manufacturing-ai-suite/industrial-edge-insights-multimodal/configs/dlstreamer-pipeline-server

for id in $(curl -k --location https://localhost:3000/dsps-api/pipelines/status \
| grep -oP '"id":\s*"\K[^"]+'); do
    curl -k --location -X DELETE "https://localhost:3000/dsps-api/pipelines/$id"
done;

curl -k https://localhost:3000/dsps-api/pipelines/user_defined_pipelines/weld_defect_classification \
  -X POST -H 'Content-Type: application/json' \
  -d "$(sed 's/"device": "CPU"/"device": "GPU"/' pipeline-request-cpu.json)"
To run inference on
NPU, use:Note: Ensure NPU support is available on your platform before running NPU inference.
cd edge-ai-suites/manufacturing-ai-suite/industrial-edge-insights-multimodal/configs/dlstreamer-pipeline-server

for id in $(curl -k --location https://localhost:3000/dsps-api/pipelines/status \
| grep -oP '"id":\s*"\K[^"]+'); do
  curl -k --location -X DELETE "https://localhost:3000/dsps-api/pipelines/$id"
done;

curl -k https://localhost:3000/dsps-api/pipelines/user_defined_pipelines/weld_defect_classification \
  -X POST -H 'Content-Type: application/json' \
  -d "$(sed 's/"device": "CPU"/"device": "NPU"/' pipeline-request-cpu.json)"
Note: When stopping the pipeline, Grafana may display the error message: “Error: stream not found, retrying in some seconds”. This is expected behavior. The stream will automatically reconnect and resume in Grafana once the pipeline is started again.
Verify the Multimodal Weld Defect Detection Results#
Get into the InfluxDB* container.
Note: Use
kubectl exec -it <influxdb-pod-name> -n <namespace> -- /bin/bashfor the helm deployment where for <namespace> replace with namespace name where the application was deployed and for <influxdb-pod-name> replace with InfluxDB pod name.docker exec -it ia-influxdb bash
Run the following commands to see the data in InfluxDB*.
NOTE: Please ignore the error message
There was an error writing history file: open /.influx_history: read-only file systemhappening in the InfluxDB shell. This does not affect any functionality while working with the InfluxDB commands# For below command, the INFLUXDB_USERNAME and INFLUXDB_PASSWORD needs to be fetched from `.env` file influx -username <username> -password <passwd> use datain # database access show measurements # Run below query to check and output measurement processed # by Time Series Analytics microservice select * from "weld-sensor-anomaly-data" # Run below query to check and output measurement processed # by DL Streamer pipeline server microservice select * from "vision-weld-classification-results"
Check the output in Grafana.
Use link
https://<host_ip>:3000to launch Grafana from browser (preferably, chrome browser)
Note: Use link
https://<host_ip>:30001to launch Grafana from browser (preferably Chrome browser) for the Helm deploymentLogin to the Grafana with values set for
VISUALIZER_GRAFANA_USERandVISUALIZER_GRAFANA_PASSWORDin.envfile and select Multimodal Weld Defect Detection Dashboard.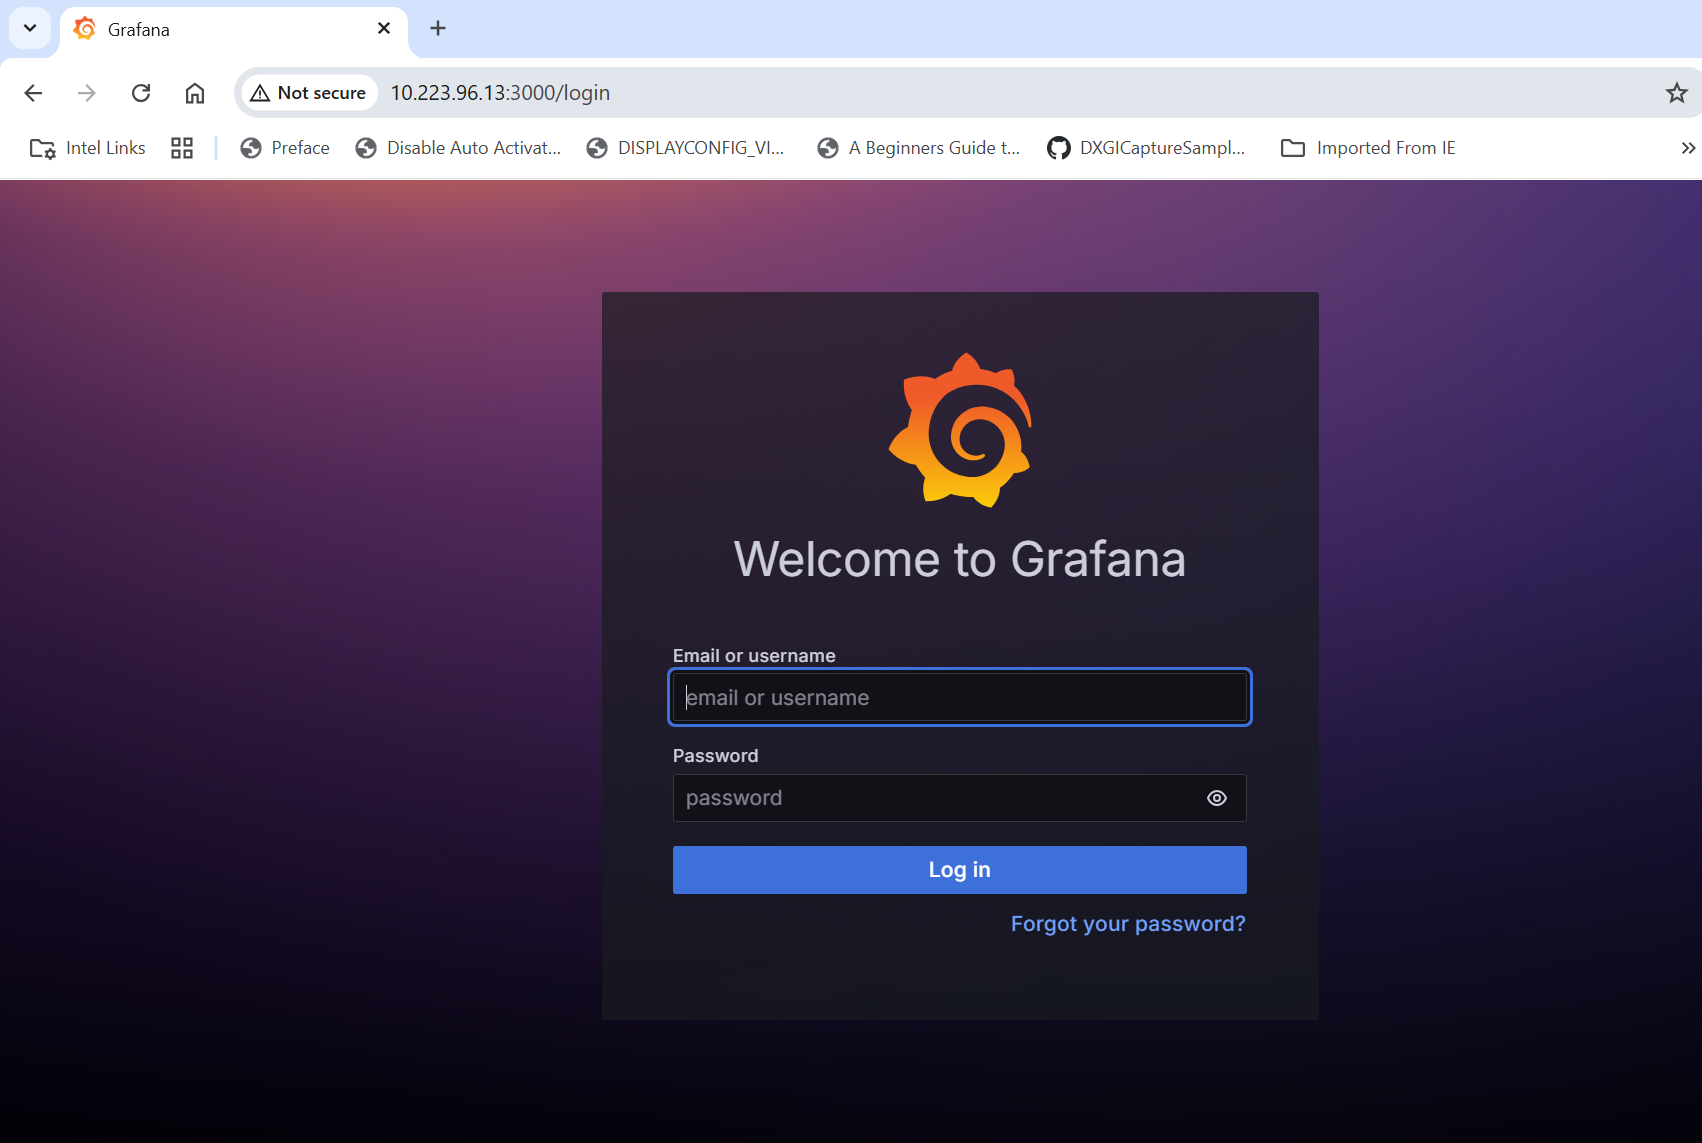
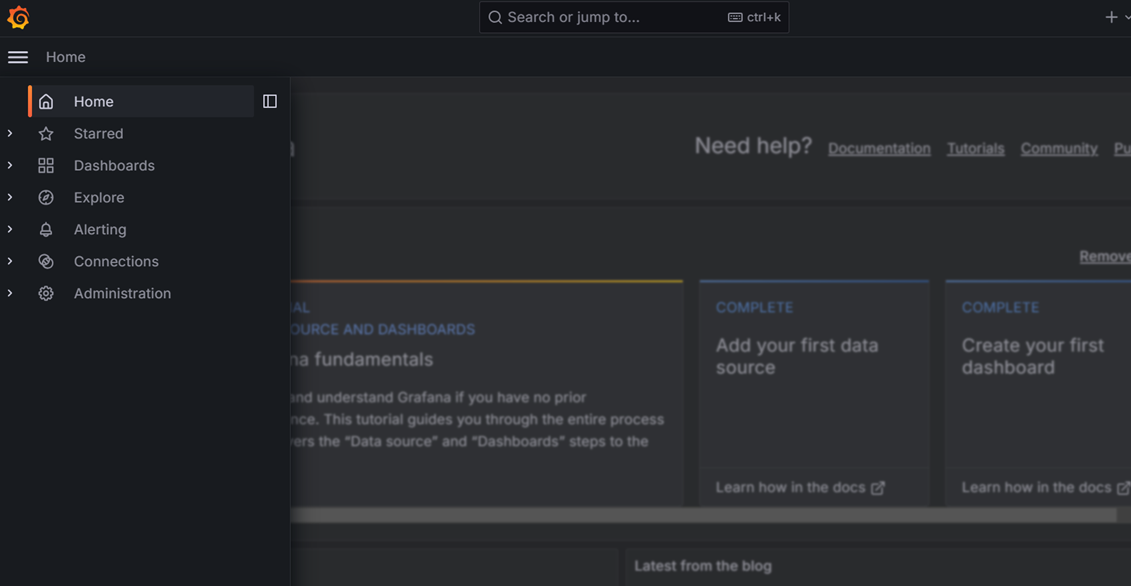
After login, click on Dashboard
Select the
Multimodal Weld Defect Detection Dashboard.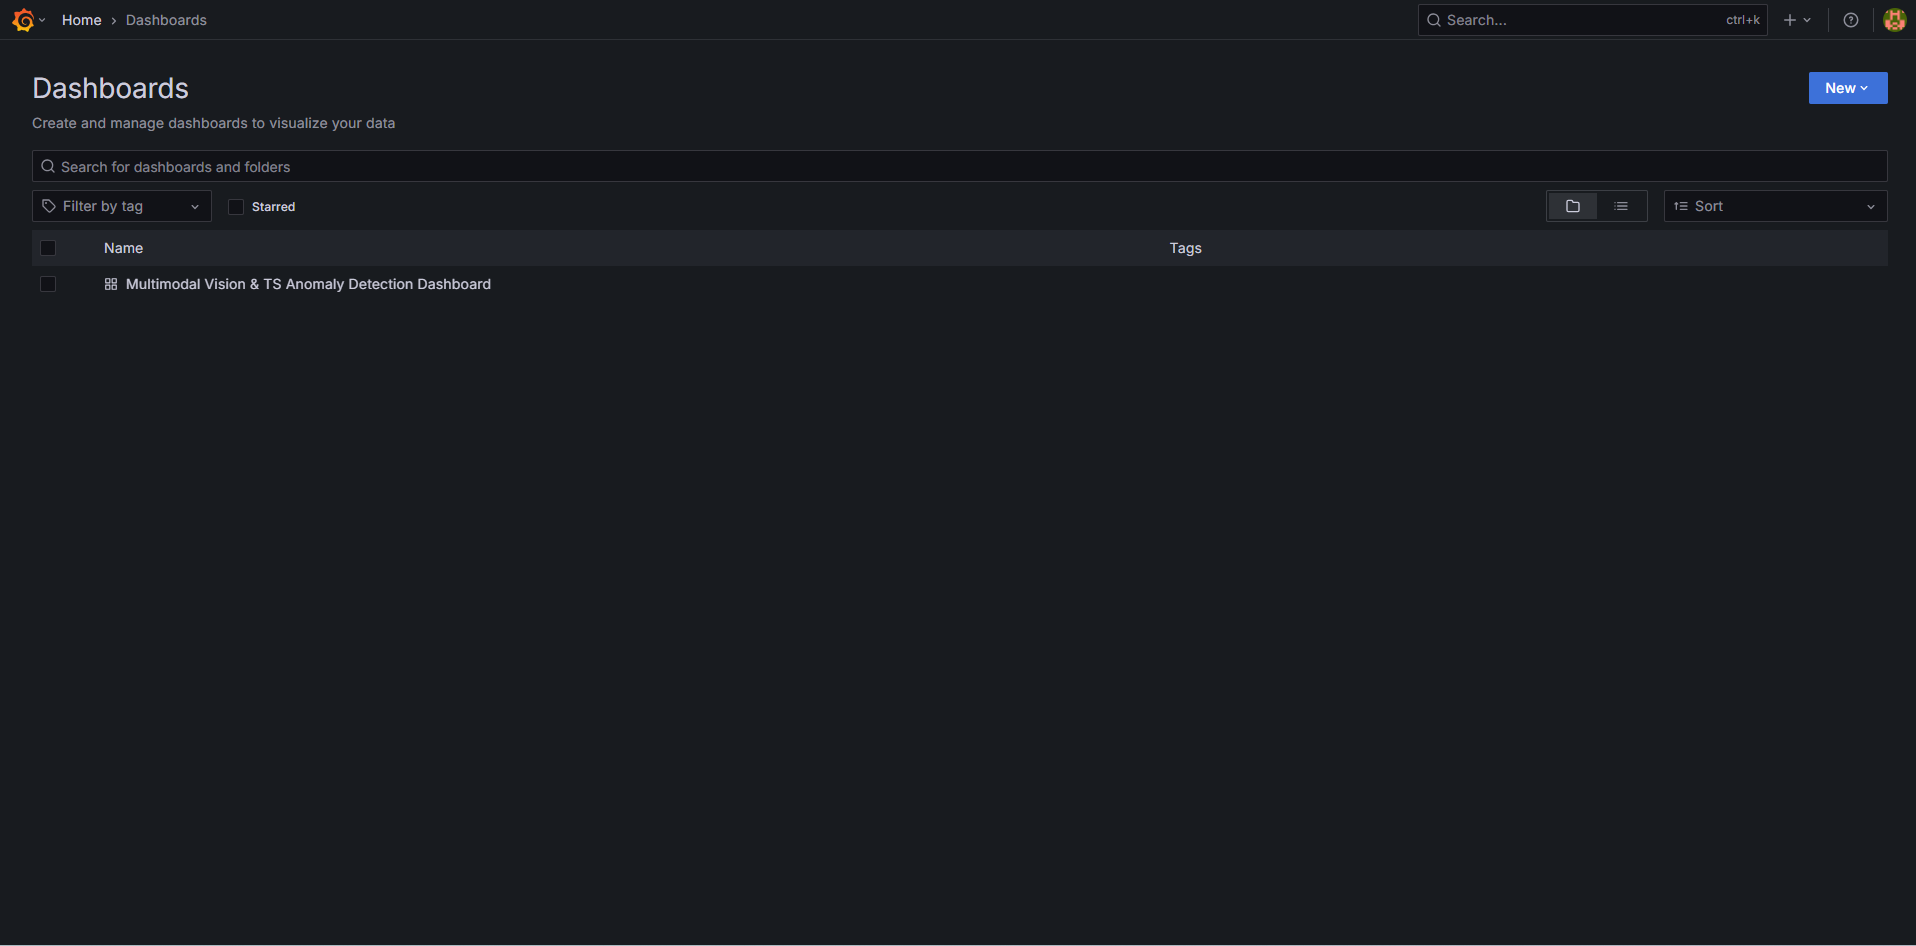
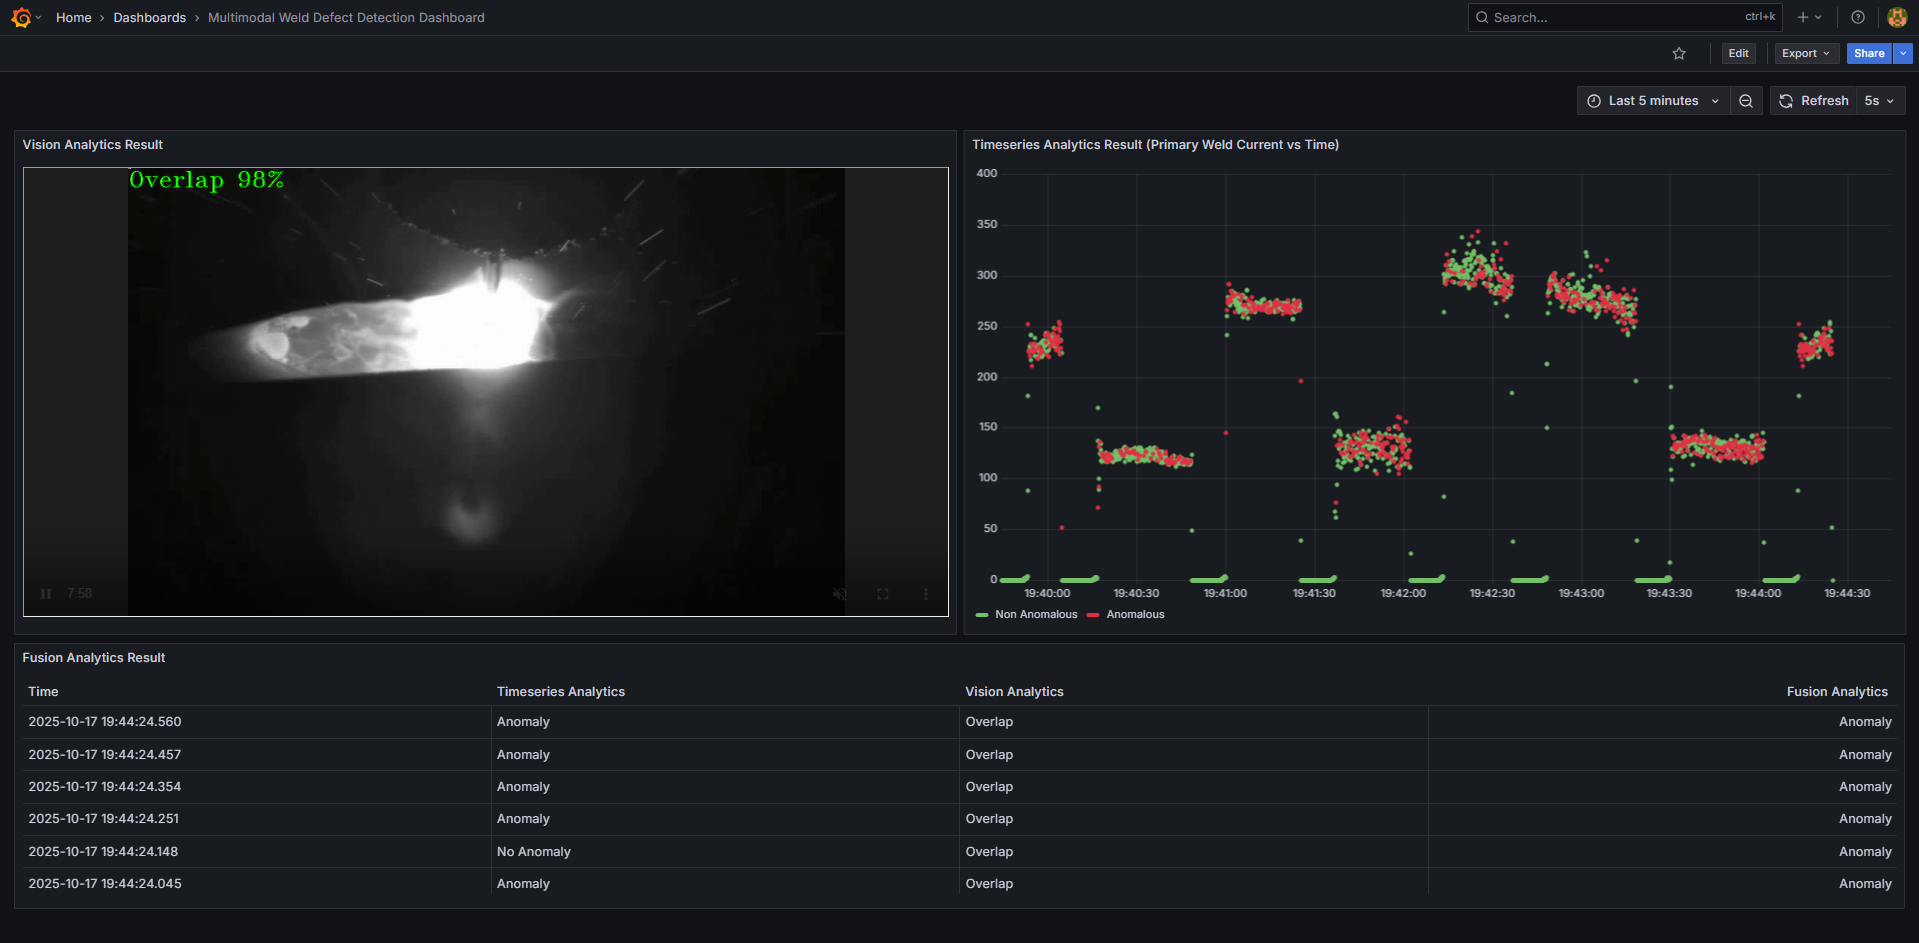
One will see the below output.
Bring down the sample app#
cd edge-ai-suites/manufacturing-ai-suite/industrial-edge-insights-multimodal
make down
Check logs - troubleshooting#
Check the container logs to catch any failures:
docker ps
docker logs -f <container_name>
docker logs -f <container_name> | grep -i error
Advanced setup#
How to build from source and deploy: Guide to build from source and docker compose deployment
How to deploy with Helm: Guide for deploying with Helm.
How to configure MQTT alerts: Guide for configuring the MQTT alerts in the Time Series Analytics microservice
How to update config: Guide updating configuration of Time Series Analytics Microservice.