Visual AI Demo Kit - Tutorial 3#
This tutorial guides you through creating a custom Grafana dashboard that displays real-time object detection video streams and data analytics. You’ll build an integrated monitoring solution that combines visual feeds with data tables for comprehensive metro vision monitoring.
By following this guide, you will learn how to:
Create Custom Dashboards: Build new Grafana dashboards tailored for metro vision applications
Integrate Video Streams: Embed real-time WebRTC video feeds using HTML panels
Visualize MQTT Data: Create dynamic tables that display live object detection data from MQTT streams
Prerequisites#
Verify that your metro vision AI application is running: Setup Guide
Verify that your Node Red flow setup is completed: Node Red Flow
Access to Grafana dashboard (typically at
https://localhost/grafana)WebRTC streaming service configured and operational
MQTT broker running with object detection data feed
Set up and First Use#
1. Create a New Dashboard#
Access Grafana Interface:
Open your web browser and navigate to
https://localhost/grafanaLog in with your Grafana credentials
Username: admin
Password: admin
Create New Dashboard:
Click the “+” icon in the left sidebar
Select “Dashboard” from the dropdown menu
Select “New Dashboard” from the top right menu
Click “Add Visualization”
2. Add Real-Time Video Stream Panel#
Create HTML Panel:
In the panel editor, change the visualization type to “Text” (On Right side of Visualization Editor)
Switch to “HTML” mode
Add the following iframe code:
In the below code update <HOST_IP> to your host IP address. If you are testing on localhost, update it to localhost.
<iframe
  src="https://<HOST_IP>/mediamtx/object_detection_1/"
  style="width:100%;height:500px;"
  allow="autoplay; encrypted-media"
  frameborder="0">
</iframe>
Configure Panel Settings:
Set panel title to “Live Object Detection Feed”
Click “Save Dashboard” to save the panel
Adjust panel size as needed.
3. Create MQTT Data Table#
Add New Panel:
Click “Add Visualization” to create another visualization
Select “Table” as the visualization type (On Right side of Visualization Editor)
Set panel title to “Real time Object Detection Data”
Configure Data Source:
Set your MQTT data source as “grafana-mqtt-datasource”
Configure topic to fetch object detection metrics
Update Topic to “enhanced”
Add Transformations (Optional):
You can add different types of transformations to this dashboard panel.
4. Configure Dashboard Layout#
Arrange Panels:
Drag and resize panels for optimal viewing
Position video feed in the upper section
Place data table below or alongside the video
Save Dashboard:
Click the save icon (disk symbol)
Name your dashboard “Metro Vision Object Detection”
Add appropriate tags for organization
Expected Results#

If you are unable to visualize any data, try restarting the inference pipeline.
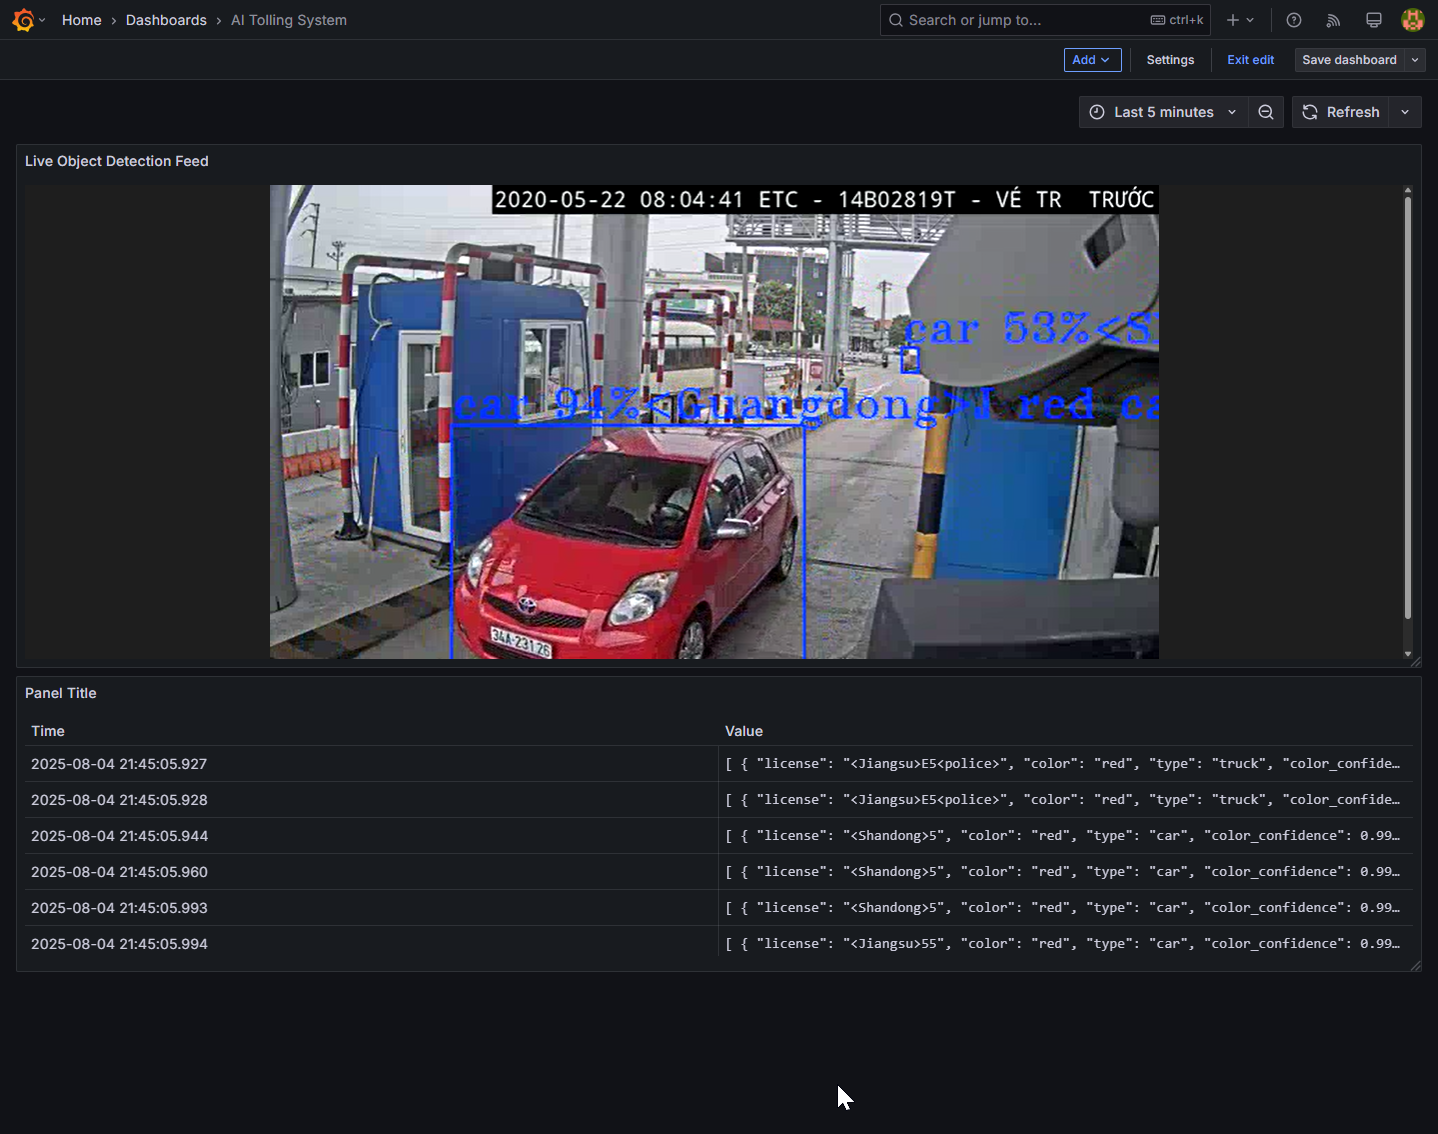
After completing this tutorial, you should have:
Interactive Dashboard: A custom Grafana dashboard displaying real-time video and data
Live Video Feed: WebRTC stream showing object detection overlay
Dynamic Data Table: Real-time MQTT data updates with detection information
Integrated Monitoring: Combined visual and analytical view of metro vision system
Troubleshooting#
Video Stream Not Loading
Verify WebRTC service is running:
docker ps | grep webrtcCheck WEBRTC_URL environment variable configuration
Ensure browser permissions allow autoplay and camera access
MQTT Data Not Appearing
Confirm MQTT broker connection in Grafana data sources
Validate MQTT topic subscription and message format
Check query syntax for your specific data source
Dashboard Performance Issues
Reduce refresh intervals if system is slow
Limit data query time ranges
Consider using data aggregation for high-volume streams