How to Deploy with the Edge Orchestrator#
Edge Orchestrator, part of Intel’s Edge Software, simplifies edge application deployment and management, making it easier to deploy edge solutions at scale. Edge Orchestrator provides:
Secure Infrastructure Management: Offers secure and efficient remote onboarding and management of your edge node fleet across sites and geographies. Zero-trust security configuration reduces the time required to secure your edge applications.
Deployment Orchestration and Automation: Lets you roll out and update applications and configure infrastructure nodes across your network from a single pane of glass. Edge Orchestrator provides automated cluster orchestration and dynamic application deployment.
Automated Deployment: Automates the remote installation and updating of applications at scale.
Deep Telemetry: Gives you policy-based life cycle management and centralized visibility into your distributed edge infrastructure and deployments.
Flexible Configuration: From organizing your physical infrastructure to managing the permutations of executing applications in a variety of runtime environments, Edge Orchestrator gives you the flexibility to define the policies, criteria, and hierarchies that make the most sense for your specific business needs.
To deploy the Loitering Detection Sample Application with the Edge Orchestrator, follow the steps described in this document.
Procedure to Deploy with Edge Orchestrator#
Prerequisites#
Access to the web interface of the Edge Orchestrator with one or more Edge Nodes Onboarded to the Edge Orchestrator.
Clusters with a privilege template have been created on the needed Edge Nodes following the procedures described in Create Cluster.
Making the Deployment Package Available#
Clone the Loitering Detection repository:
git clone https://github.com/open-edge-platform/edge-ai-suites
cd edge-ai-suites/metro-ai-suite/loitering-detection
From the web browser, open the URL of the Edge Orchestrator and import the Deployment Package present in the folder deployment-package following the steps described in Import Deployment Package.
Once the deployment package has been imported into the Edge Orchestrator, you can see it in the list of Web UI.
See Deployment Packages for more information on deployment packages.
Deploy the Application onto the Edge Nodes#
To set up a deployment:
Click the Deployments tab on the top menu to view the Deployments page. On the Deployments page, you can view the list of deployments that have been created. The status indicator shows a quick view of the status of the deployment, which depends on many factors.
Select the Deployments tab and click the Setup a Deployment button. The Setup a Deployment page appears.
On the Setup a Deployment page, select the ld package for the deployment from the list, and click Next. The Select a Profile step appears.
In the Select a Profile step, select the deployment profile, and click Next. The Override Profile Values page appears.
The Override Profile Values page shows the deployment profile values that are available for overriding. Provide the necessary overriding values, then click Next to proceed to the Select Deployment Type step.
On the Select Deployment Type page, select the type of deployment, and click Next:
If you select Automatic as the deployment type, enter the deployment name and metadata in key-value format to select the target cluster.
If you select Manual as the deployment type, enter the deployment name and select the clusters from the list of clusters.
Click Next to view the Review page.
Verify if the deployment details are correct and click Deploy.
After a few minutes, the deployment will start and will take about 5 minutes to complete.
In the Edge Orchestrator Web UI, you can track the application installation through the View Deployment Details view.
The Loitering Detection Sample Application is fully deployed when the applications become green and the status is shown as Running.
You can view the deployment status on the Deployments page.
Note: If the deployment fails for any reason, the deployment status will display the “Error” or “Down” status.
For more information on setting up a deployment, see Set up a Deployment.
Running the AI Pipeline for Loitering Detection sample application#
Start the application with the Client URL (cURL) command by replacing the <HOST_IP> with the Node IP. (Total 8 places)
curl http://<HOST_IP>:30385/pipelines/user_defined_pipelines/object_tracking_1 -X POST -H 'Content-Type: application/json' -d '
{
    "source": {
        "uri": "file:///home/pipeline-server/videos/VIRAT_S_000101.mp4",
        "type": "uri"
    },
    "destination": {
        "metadata": {
            "type": "mqtt",
            "host": "<HOST_IP>:30383",
            "topic": "object_tracking_1",
            "timeout": 1000
        },
        "frame": {
            "type": "webrtc",
            "peer-id": "object_tracking_1"
        }
    },
    "parameters": {
        "detection-device": "CPU"
    }
}'

curl http://<HOST_IP>:30385/pipelines/user_defined_pipelines/object_tracking_2 -X POST -H 'Content-Type: application/json' -d '
{
    "source": {
        "uri": "file:///home/pipeline-server/videos/VIRAT_S_000102.mp4",
        "type": "uri"
    },
    "destination": {
        "metadata": {
            "type": "mqtt",
            "host": "<HOST_IP>:30383",
            "topic": "object_tracking_2",
            "timeout": 1000
        },
        "frame": {
            "type": "webrtc",
            "peer-id": "object_tracking_2"
        }
    },
    "parameters": {
        "detection-device": "CPU"
    }
}'

curl http://<HOST_IP>:30385/pipelines/user_defined_pipelines/object_tracking_3 -X POST -H 'Content-Type: application/json' -d '
{
    "source": {
        "uri": "file:///home/pipeline-server/videos/VIRAT_S_000103.mp4",
        "type": "uri"
    },
    "destination": {
        "metadata": {
            "type": "mqtt",
            "host": "<HOST_IP>:30383",
            "topic": "object_tracking_3",
            "timeout": 1000
        },
        "frame": {
            "type": "webrtc",
            "peer-id": "object_tracking_3"
        }
    },
    "parameters": {
        "detection-device": "CPU"
    }
}'

curl http://<HOST_IP>:30385/pipelines/user_defined_pipelines/object_tracking_4 -X POST -H 'Content-Type: application/json' -d '
{
    "source": {
        "uri": "file:///home/pipeline-server/videos/VIRAT_S_000104.mp4",
        "type": "uri"
    },
    "destination": {
        "metadata": {
            "type": "mqtt",
            "host": "<HOST_IP>:30383",
            "topic": "object_tracking_4",
            "timeout": 1000
        },
        "frame": {
            "type": "webrtc",
            "peer-id": "object_tracking_4"
        }
    },
    "parameters": {
        "detection-device": "CPU"
    }
}'
View the Grafana and WebRTC streaming on
http://<HOST_IP>:30380.Log in with the following credentials:
Username:
adminPassword:
admin
Check under the Dashboards section for the default dashboard named “Video Analytics Dashboard”.
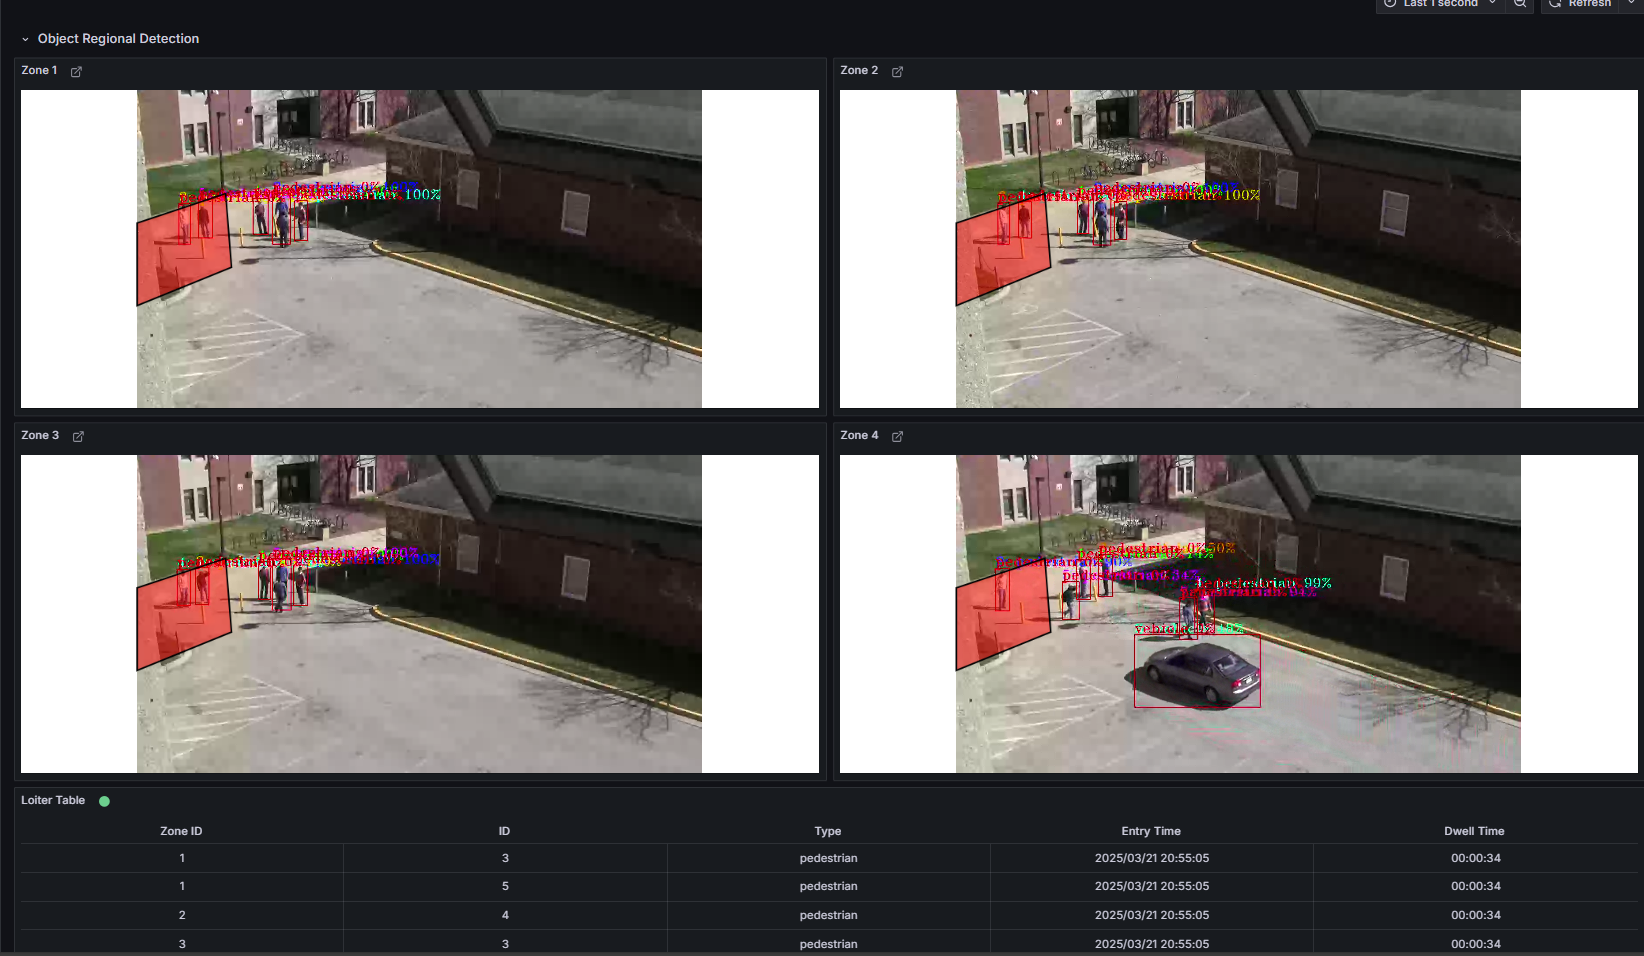
Figure 1: Grafana and WebRTC streaming