Get Started#
Loitering Detection leverages advanced AI algorithms to monitor and analyze real-time video feeds, identifying individuals lingering in designated areas. It provides a modular architecture that integrates seamlessly with various input sources and leverages AI models to deliver accurate and actionable insights.
By following this guide, you will learn how to:
Set up the sample application: Use Docker Compose to quickly deploy the application in your environment.
Run a predefined pipeline: Execute a pipeline to see loitering detection in action.
Access the application’s features and user interfaces: Explore the Grafana dashboard, Node-RED interface, and DL Streamer Pipeline Server to monitor, analyze and customize workflows.
Prerequisites#
Verify that your system meets the minimum requirements.
Install Docker: Installation Guide. Enable running docker without “sudo”: Post Install
Install Git: Installing Git
Set up and first use#
Clone the Repository:
Run:
git clone https://github.com/open-edge-platform/edge-ai-suites.git
cd edge-ai-suites/metro-ai-suite/metro-vision-ai-app-recipe/
Setup Application and Download Assets:
Use the installation script to configure the application and download required models:
./install.sh loitering-detection
Specify Custom Host IP Address (Advanced Configuration)
For environments requiring a specific host IP address (such as when using Edge Manageability Toolkit or deploying across different network interfaces), you can explicitly specify the IP address:
./install.sh loitering-detection <HOST_IP>
Replace
<HOST_IP>with your target IP address.
Run the application#
Start the Application:
Download container images with Application microservices and run with Docker Compose:
docker compose up -d
Check Status of Microservices
The application starts the following microservices.
To check if all microservices are in Running state:
docker ps
Expected Services:
Grafana Dashboard
DL Streamer Pipeline Server
MQTT Broker
Node-RED (for applications without Scenescape)
Scenescape services (for Smart Intersection only)
Run Predefined Pipelines:
Start video streams to run video inference pipelines:
./sample_start.sh
Check Status and Stop pipelines
To check the status:
./sample_status.sh
To stop the pipelines without waiting for video streams to finish replay:
./sample_stop.sh
View the Application Output:
Open a browser and go to
http://localhost:3000to access the Grafana dashboard.Change the localhost to your host IP if you are accessing it remotely.
Log in with the following credentials:
Username:
adminPassword:
admin
Check under the Dashboards section for the application-specific preloaded dashboard.
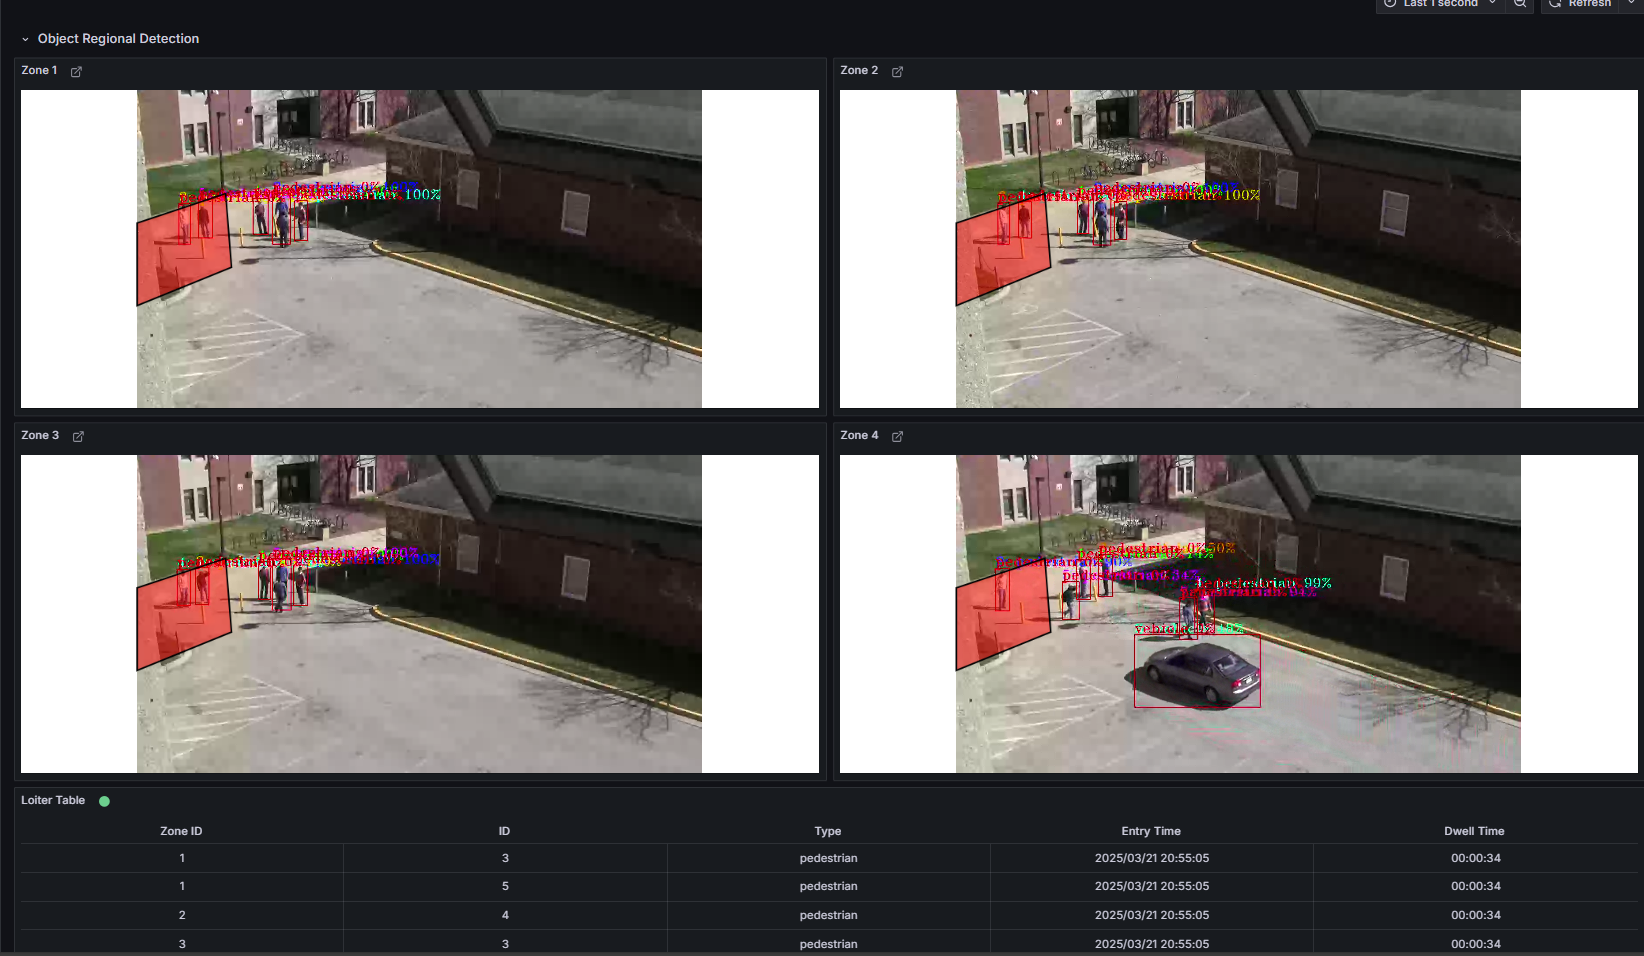
Expected Results: The dashboard displays real-time video streams with AI overlays and detection metrics.
Access the Application and Components#
Grafana UI#
Log in with credentials:
Username:
adminPassword:
admin(You will be prompted to change it on first login.)
In Grafana UI, the dashboard displays detected people and cars
NodeRED UI#
DL Streamer Pipeline Server#
REST API: http://localhost:8080
Check Pipeline Status:
curl http://localhost:8080/pipelines
Stop the Application:#
To stop the application microservices, use the following command:
docker compose down
Other Deployment Option#
Choose one of the following methods to deploy the Loitering Detection Sample Application:
Deploy Using Helm: Use Helm to deploy the application to a Kubernetes cluster for scalable and production-ready deployments.
Next Steps#
Troubleshooting#
Changing the Host IP Address
If you need to use a specific Host IP address instead of the one automatically detected during installation, you can explicitly provide it using the following command. Replace
<HOST_IP>with your desired IP address:./install.sh <HOST_IP>
Containers Not Starting:
Check the Docker logs for errors:
docker compose logs
No Video Streaming on Grafana Dashboard
Go to the Grafana “Video Analytics Dashboard”.
Click on the Edit option (located on the right side) under the WebRTC Stream panel.
Update the URL from
http://localhost:8083tohttp://host-ip:8083.
Failed Grafana Deployment
If unable to deploy grafana container successfully due to fail to GET “https://grafana.com/api/plugins/yesoreyeram-infinity-datasource/versions”: context deadline exceeded, please ensure the proxy is configured in the ~/.docker/config.json as shown below:
        "proxies": {
                "default": {
                        "httpProxy": "<Enter http proxy>",
                        "httpsProxy": "<Enter https proxy>",
                        "noProxy": "<Enter no proxy>"
                }
        }
After editing the file, remember to reload and restart docker before deploying the microservice again.
systemctl daemon-reload
systemctl restart docker