Run Multiple AI Pipelines in Vision AI Detection Apps#
In a typical deployment, multiple cameras deliver video streams that are connected to AI pipelines to improve the detection and recognition accuracy.
The DL Streamer Pipeline Server config supports multiple pipelines that you can use to launch pipeline instances. The sample application has been provided with such a config, i.e., pipeline-server-config.json. This guide demonstrates using the config to launch multiple AI pipelines.
Steps#
The following demonstrates running two AI pipelines.
Note This guide assumes that the model and sample video are already available in the application directory under
resources/.
Note: If you are running multiple instances of the applications, ensure to provide
NGINX_HTTPS_PORTnumber in the URL for the app instance, i.e., replace<HOST_IP>with<HOST_IP>:<NGINX_HTTPS_PORT>. If you are running a single instance and using anNGINX_HTTPS_PORTother than the default 443, replace<HOST_IP>with<HOST_IP>:<NGINX_HTTPS_PORT>.
Bring up the containers.
Note: If you are running multiple instances of the applications, start the services using
./run.sh upinstead.docker compose up -d
Start the selected pipeline with the following Client URL (cURL) command, replacing
<HOST_IP>with the system IP and setting thepeer-idparameter with an appropriate string id (e.g.,pdd, oranomaly1; these are pre-filled in the examples below). This pipeline is configured to run in a loop forever. This REST/cURL request will return a pipeline instance ID, which can be used as an identifier to later query the pipeline status or stop the pipeline instance (the instance-ID will look like this: a6d67224eacc11ec9f360242c0a86003, for example).curl -k https://<HOST_IP>/api/pipelines/user_defined_pipelines/pallet_defect_detection_mlops -X POST -H 'Content-Type: application/json' -d '{ "destination": { "frame": { "type": "webrtc", "peer-id": "pdd" } }, "parameters": { "detection-properties": { "model": "/home/pipeline-server/resources/models/pallet-defect-detection/deployment/Detection/model/model.xml", "device": "CPU" } } }'
curl -k https://<HOST_IP>/api/pipelines/user_defined_pipelines/pcb_anomaly_detection_mlops -X POST -H 'Content-Type: application/json' -d '{
   "destination": {
       "frame": {
           "type": "webrtc",
           "peer-id": "anomaly1"
       }
   },
   "parameters": {
       "classification-properties": {
           "model": "/home/pipeline-server/resources/models/pcb-anomaly-detection/deployment/Anomaly classification/model/model.xml",
           "device": "CPU"
       }
   }
}'
Start another pipeline with the following Client URL (cURL) command, replacing
<HOST_IP>with the system IP and setting thepeer-idparameter with a different string id than the one in the above step (e.g.,pddstreamandanomaly2; these are pre-filled in the examples below). This pipeline is not configured to run in a loop forever. This REST/cURL request will also return a pipeline instance ID, which can be used as an identifier to later query the pipeline status or stop the pipeline instance.curl -k https://<HOST_IP>/api/pipelines/user_defined_pipelines/pallet_defect_detection -X POST -H 'Content-Type: application/json' -d '{ "source": { "uri": "file:///home/pipeline-server/resources/videos/warehouse.avi", "type": "uri" }, "destination": { "frame": { "type": "webrtc", "peer-id": "pddstream" } }, "parameters": { "detection-properties": { "model": "/home/pipeline-server/resources/models/pallet-defect-detection/deployment/Detection/model/model.xml", "device": "CPU" } } }'
curl -k https://<HOST_IP>/api/pipelines/user_defined_pipelines/pcb_anomaly_detection_mlops -X POST -H 'Content-Type: application/json' -d '{
   "destination": {
       "frame": {
           "type": "webrtc",
           "peer-id": "anomaly2"
       }
   },
   "parameters": {
       "classification-properties": {
           "model": "/home/pipeline-server/resources/models/pcb-anomaly-detection/deployment/Anomaly classification/model/model.xml",
           "device": "CPU"
       }
   }
}'
Note the instance ID of this pipeline
View the WebRTC streaming on
https://<HOST_IP>/mediamtx/<peer-str-id>/andhttps://<HOST_IP>/mediamtx/<different-peer-str-id>/.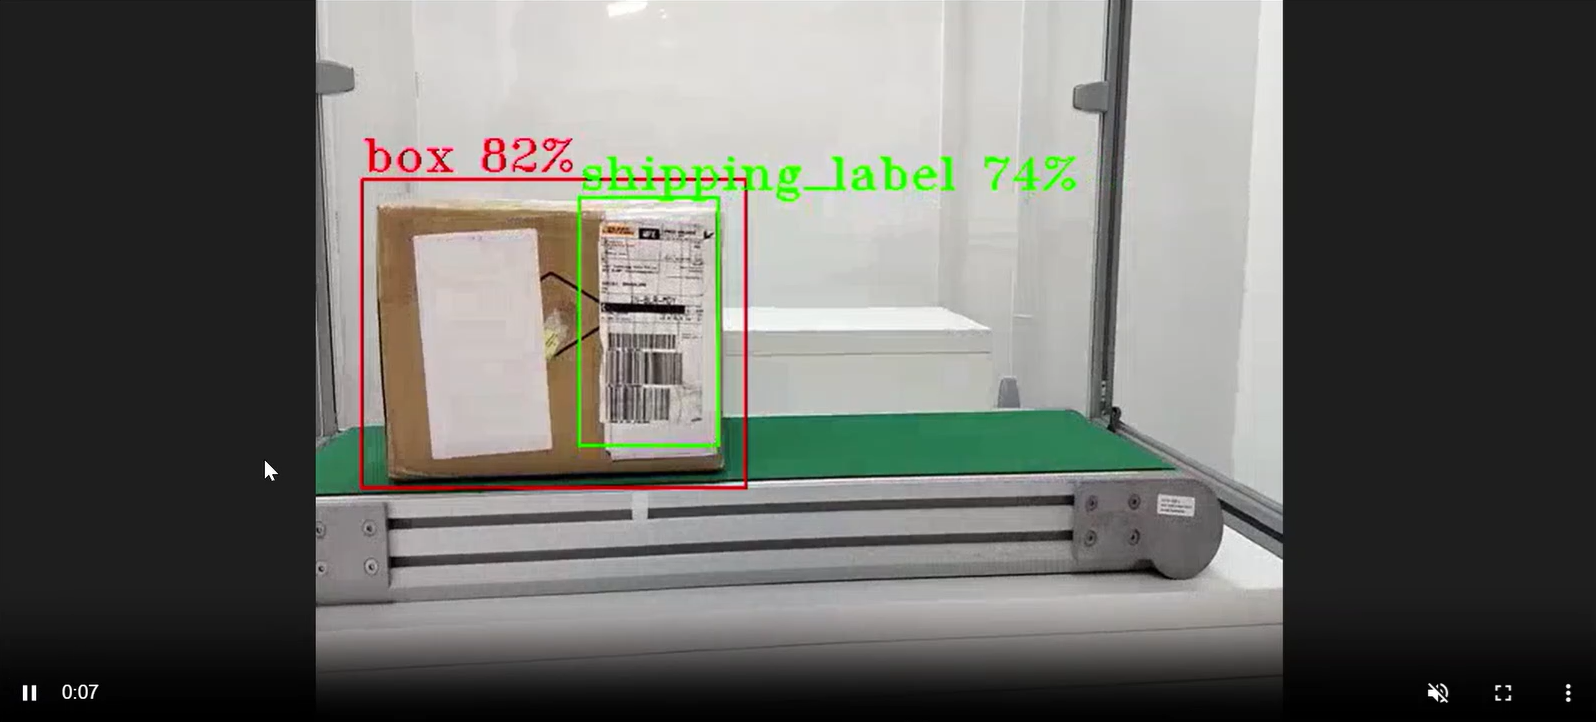
WebRTC streaming for Pallet Defect Detection
You can see boxes, shipping labels, and defects being detected. You have successfully run the sample application.
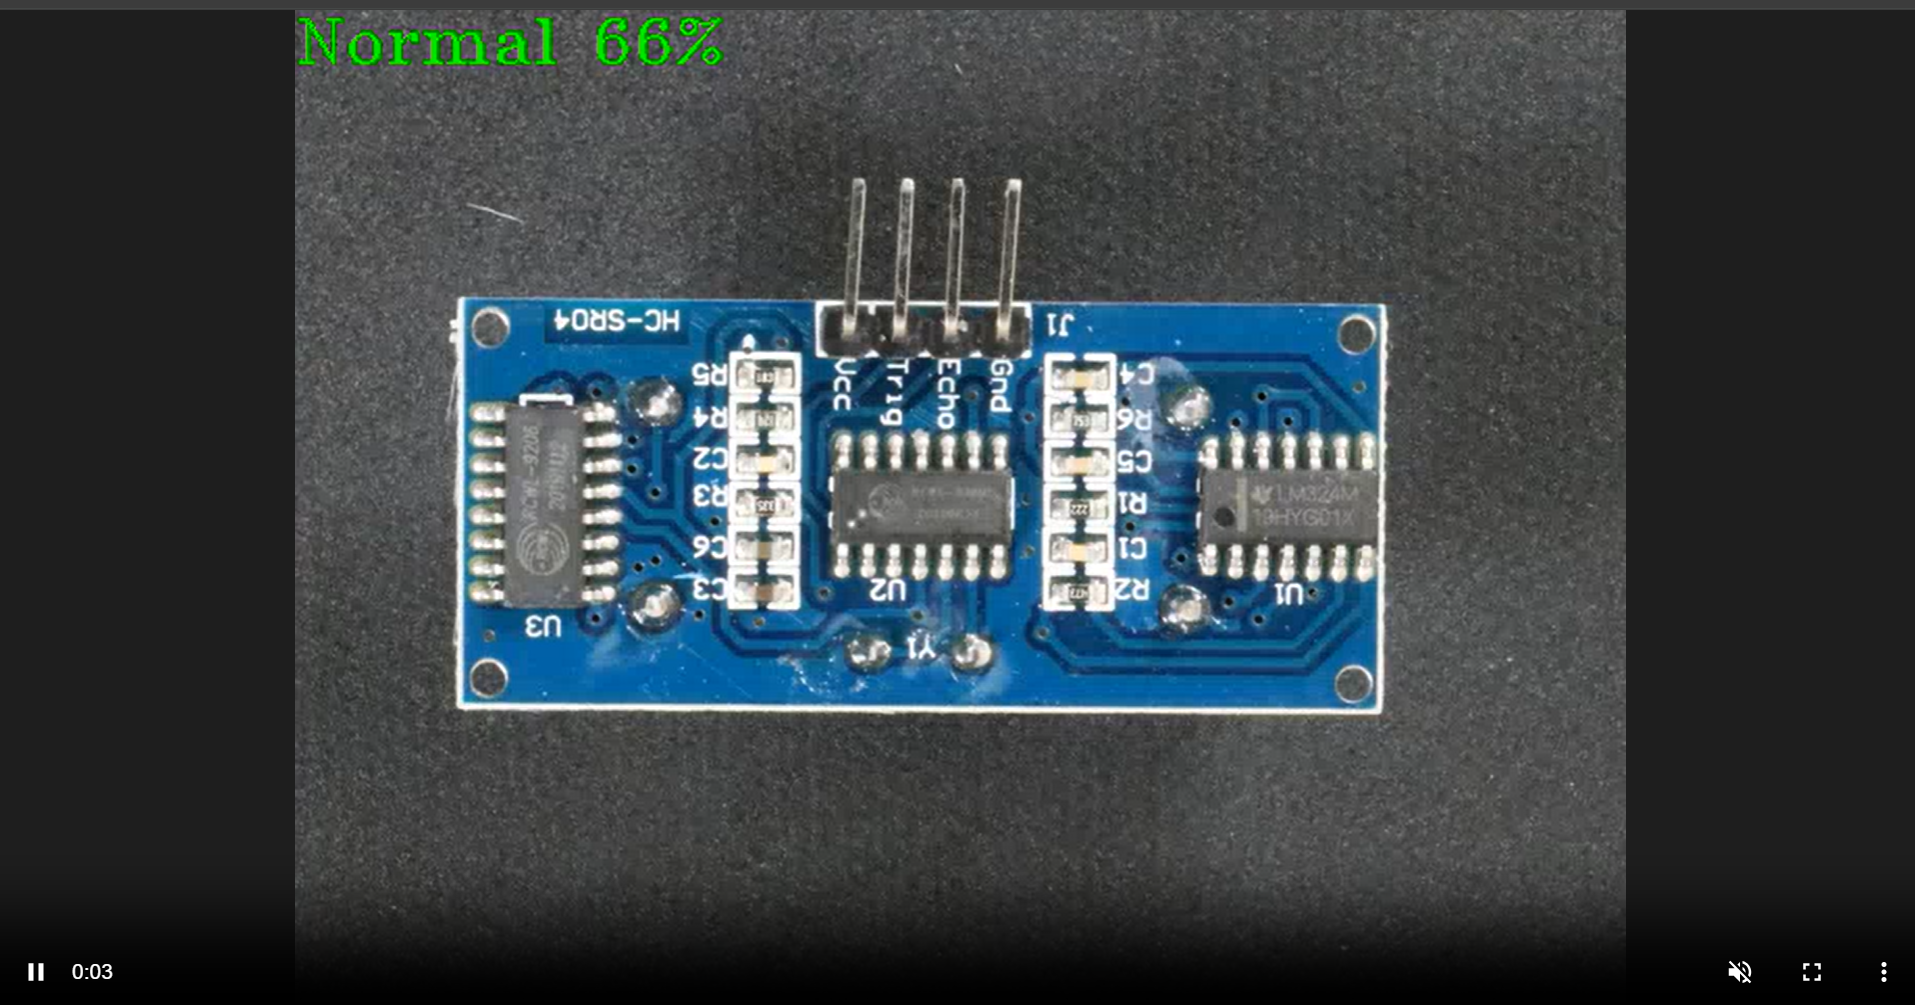
WebRTC streaming for PCB Anomaly Detection
Note: You can also observe telemetry data from the Prometheus UI. Refer to the View Open Telemetry Data document to learn more.
Stop the 2nd pipeline using the instance ID noted in point #3 above, before proceeding with this documentation.
curl -k --location -X DELETE https://<HOST_IP>/api/pipelines/{instance_id}