View Open Telemetry Data#
DL Streamer Pipeline Server supports gathering metrics over Open Telemetry. The supported metrics currently are:
cpu_usage_percentage: Tracks CPU usage percentage of DL Streamer Pipeline Server Python processmemory_usage_bytes: Tracks memory usage in bytes of DL Streamer Pipeline Server Python processfps_per_pipeline: Tracks FPS for each active pipeline instance in DL Streamer Pipeline ServerOpen
https://<HOST_IP>/prometheusin your browser to view the prometheus console and try out the below queries:Note: If you are running multiple instances of the application, ensure to provide
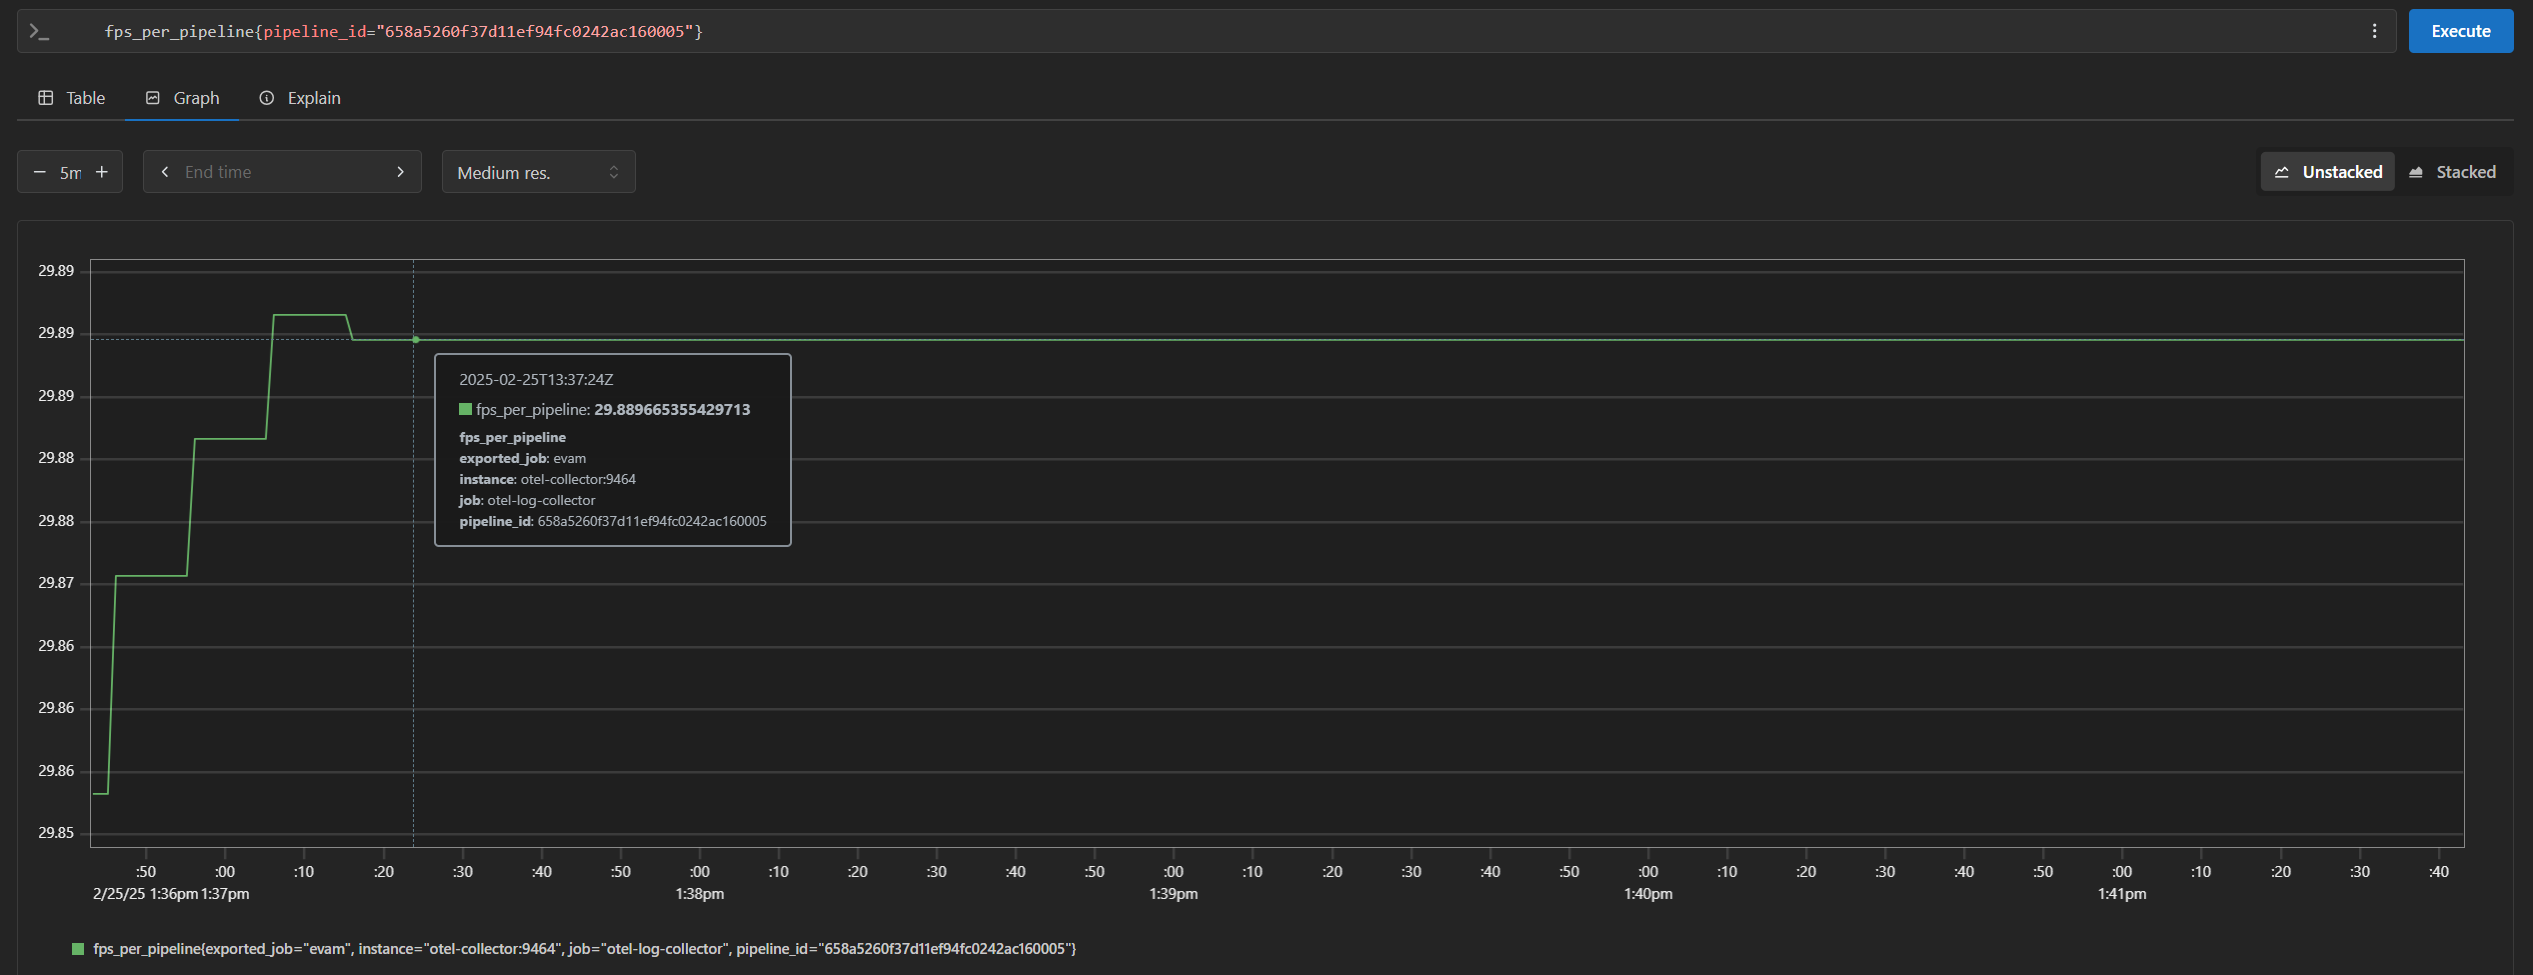
NGINX_HTTPS_PORTnumber in the URL for the app instance, i.e., replace<HOST_IP>with<HOST_IP>:<NGINX_HTTPS_PORT>If you are running a single instance and using anNGINX_HTTPS_PORTother than the default 443, replace<HOST_IP>with<HOST_IP>:<NGINX_HTTPS_PORT>.cpu_usage_percentagememory_usage_bytesfps_per_pipeline{}If you are starting multiple pipelines, then it can also be queried per pipeline ID. Example:
fps_per_pipeline{pipeline_id="658a5260f37d11ef94fc0242ac160005"}
End the demonstration#
Follow this procedure to stop the sample application and end this demonstration.
Stop the sample application with the following command.
Note: If you are running multiple instances of the application, stop the services using
./run.sh downinstead.docker compose down -v
Confirm the containers are no longer running.
docker ps