Deploy the Agentic Workflow for the Multimodal Weld Defect Detection Sample Application#
This section shows how to deploy the multimodal sample application with the agentic workflow enabled. The multimodal application produces fusion results, and when new fusion results arrive, the meta-agent in the agentic stack is triggered. The meta-agent, powered by an LLM served through OpenVINO™ model server, produces structured policy decisions, root-cause analysis, and maintenance tickets.
Architecture Overview#
The agentic workflow is implemented as a LangGraph framework-based, sequential multi-agent pipeline. The apm-agent, which is the meta-agent, acts as the orchestrator that triggers the workflow when new fusion results arrive and coordinates the execution of specialized agents, each responsible for a distinct stage of reasoning. Each agent consumes the shared execution context together with outputs from previous stages and produces traceable intermediate artifacts and a final maintenance recommendation.

Agent |
Input |
Output |
|---|---|---|
Policy Agent |
Fusion results ( |
Structured policy violation report containing the detected defect class, fusion and modality confidence scores, alignment quality, and preliminary priority. Policy decisions are based on |
Analysis Agent |
Policy output as the primary anchor, supplemented by fusion, vision, and time-series classifications for the detection window when available. |
Policy-anchored analysis summarizing the policy finding and corroborating it with modality classification data and confidence evidence; falls back to event-level or summary-level analysis when no policy output is available. |
Ticketing Agent |
Policy evaluation and root-cause analysis results. |
Structured maintenance ticket containing the priority, title, description, affected component (if available), recommended action, estimated resolution time, and defect class tags. Ticket priority and escalation follow the configured ticketing rules. |
Note
The [SYSTEM] prompt provides shared domain knowledge, including the canonical defect taxonomy, label normalization rules, and available fusion data. It establishes the common reasoning context for all agents and is not a separate execution stage.
System Requirements#
Component |
Minimum Requirement |
|---|---|
Operating System |
Ubuntu OS version 24.04 LTS or later |
Hardware |
Intel® Core™ Ultra Series 3 processor or newer |
Prerequisites#
Ensure the
.envfile is configured with valid values for:HOST_IPINFLUXDB_USERNAME,INFLUXDB_PASSWORDVISUALIZER_GRAFANA_USER,VISUALIZER_GRAFANA_PASSWORDMTX_WEBRTCICESERVERS2_0_USERNAME,MTX_WEBRTCICESERVERS2_0_PASSWORDS3_STORAGE_USERNAME,S3_STORAGE_PASSWORD
Download the Vision-Language Model (VLM) model by following the guide.
Deploy the Agentic Workflow#
Run the full agentic stack (downloads the LLM model first, then starts all containers):
Note
Model download time varies depending on network speed and hardware.
The service is polled every 5 seconds for up to 50 minutes.
Supported devices for Agentic Workflow are :
CPU,GPU
cd edge-ai-suites/manufacturing-ai-suite/industrial-edge-insights-multimodal
make up_agentic
For a fresh build before deployment:
cd edge-ai-suites/manufacturing-ai-suite/industrial-edge-insights-multimodal
make build
make up_agentic
Running the Agentic Workflow on GPU#
By default, the agentic workflow is configured to run on CPU.
To trigger the agentic workflow on GPU, update LLM_DEVICE in .env to GPU:
vi .env
# change LLM_DEVICE to GPU
LLM_DEVICE=GPU
# Deploy Agentic Workflow
make up_agentic
Configure the Agent#
Use-Case Configuration#
The agent behavior is controlled by configs/agentic/agents.yaml:
Field |
Default |
Description |
|---|---|---|
|
|
Instructs the agent to read |
|
|
Minimum |
|
|
Maximum number of |
|
|
|
|
|
|
|
|
Classes that produce |
|
|
Ticket destination: |
|
|
Submit tickets automatically after each completed run |
Defect Class Taxonomy#
The policy and ticketing agents operate on the following class hierarchy:
Priority |
Classes |
|---|---|
CRITICAL |
Burnthrough, Lack of Fusion, and Crater Cracks |
HIGH |
Excessive Penetration |
MEDIUM |
Porosity, Porosity with Excessive Penetration, Undercut, and Warping |
LOW |
Overlap, Spatter, and Excessive Convexity |
Non-actionable |
Good Weld, No Weld, and No Label |
Prompts#
Agent reasoning prompts are in configs/agentic/prompts/weld-quality-monitoring.txt. Each [TAG] block maps directly to an agent stage:
Section |
Controls |
|---|---|
|
Canonical class labels, label normalization rules ( |
|
How violations are identified: |
|
Policy-anchored analysis treating the policy decision as the source of truth; corroborates with fusion and modality data when available; falls back to event-level or summary-level analysis when no policy output exists |
|
Escalation rules tied to defect class and |
Fallback Policy#
configs/agentic/policy_fallback.json defines per-class thresholds and actions used by apm-agent when LLM_MODE=fallback. Available actions:
Action |
Description |
|---|---|
|
Stop the production line immediately |
|
Reduce welding current or power |
|
Flag for next-shift inspection |
|
Adjust process parameters |
|
Check part fixturing and alignment |
|
Continue monitoring without action |
|
No action required |
Verify the Deployment#
Check overall stack health:
cd edge-ai-suites/manufacturing-ai-suite/industrial-edge-insights-multimodal
make status
Check the output in Grafana dashboard:
Use the link
https://localhost:3000to open Grafana dashboard in a browser, preferably the Chrome browser. For Helm deployment, use the linkhttps://localhost:30001.Log in to Grafana dashboard using the
VISUALIZER_GRAFANA_USERandVISUALIZER_GRAFANA_PASSWORDvalues from the.envfile: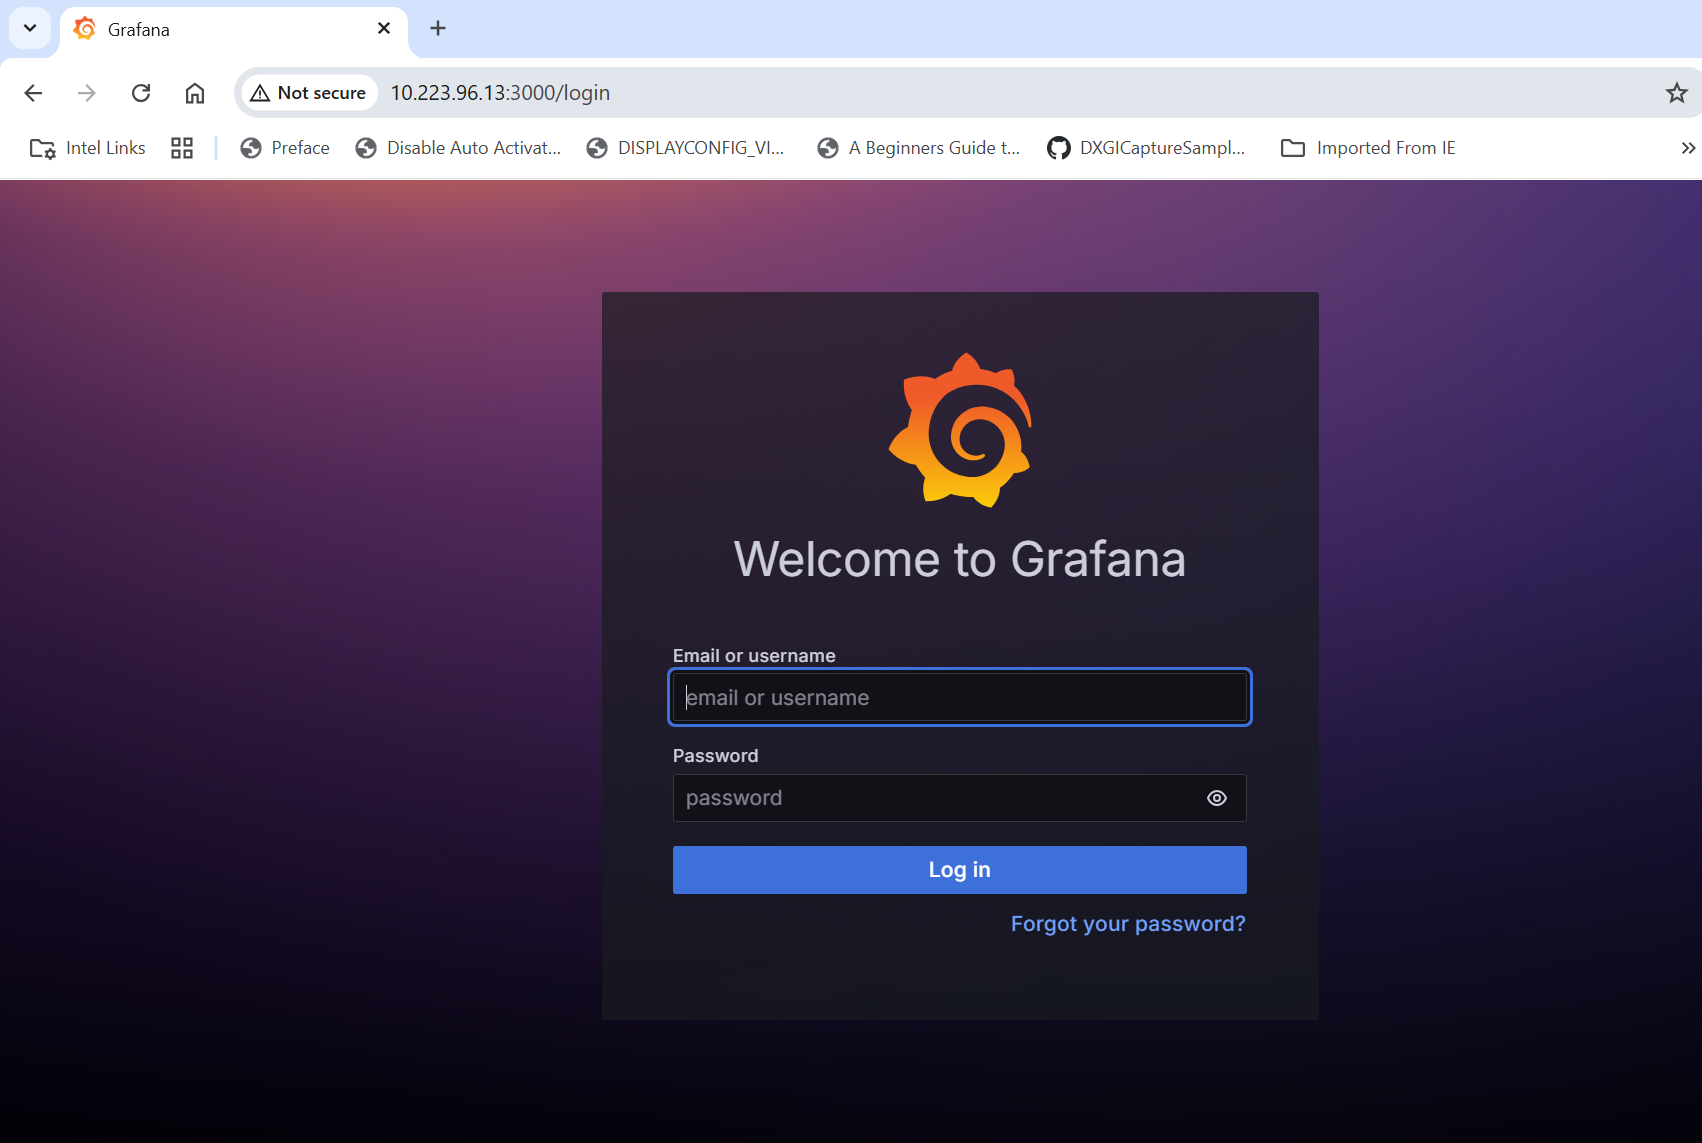
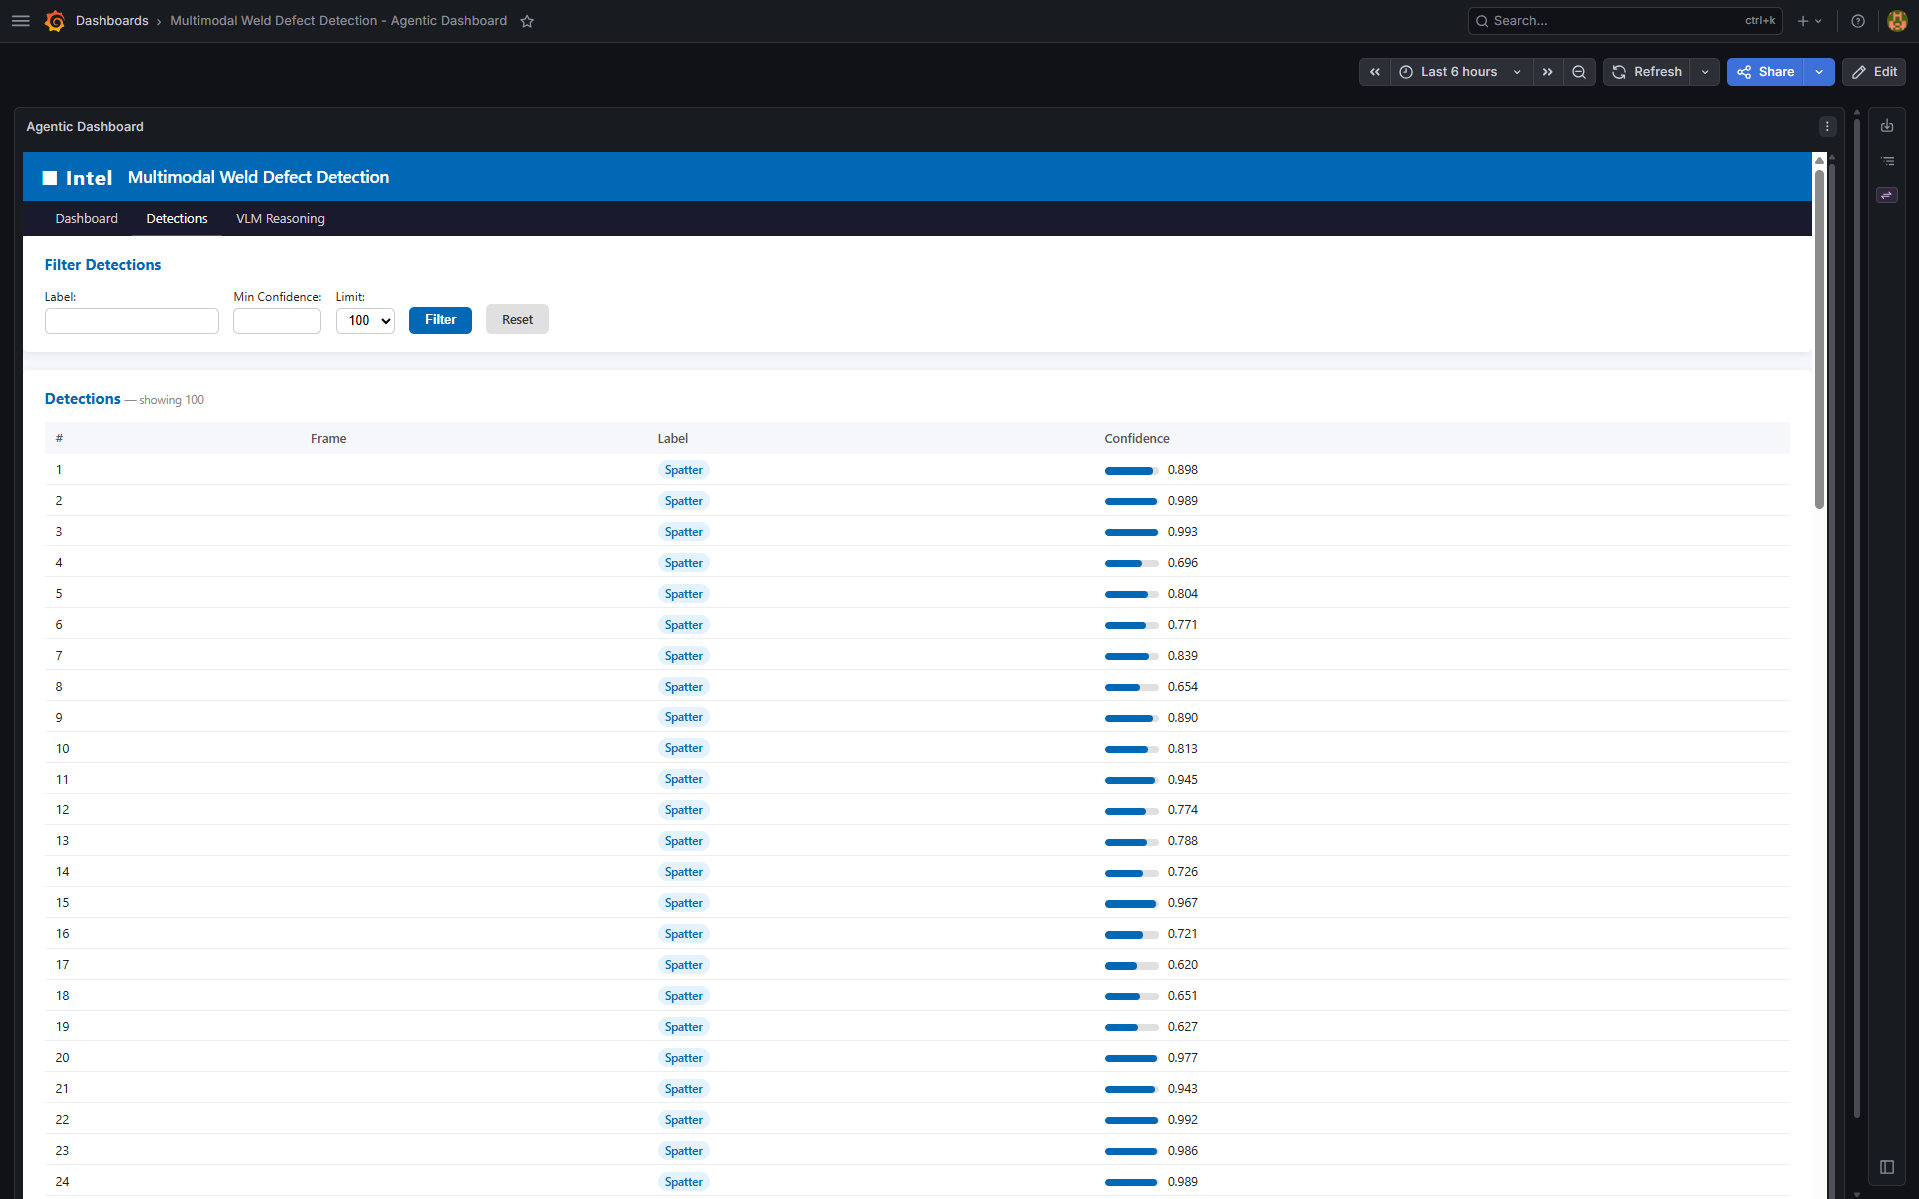
After logging in, click Dashboards and then select Multimodal Weld Defect Detection - Agentic Dashboard:
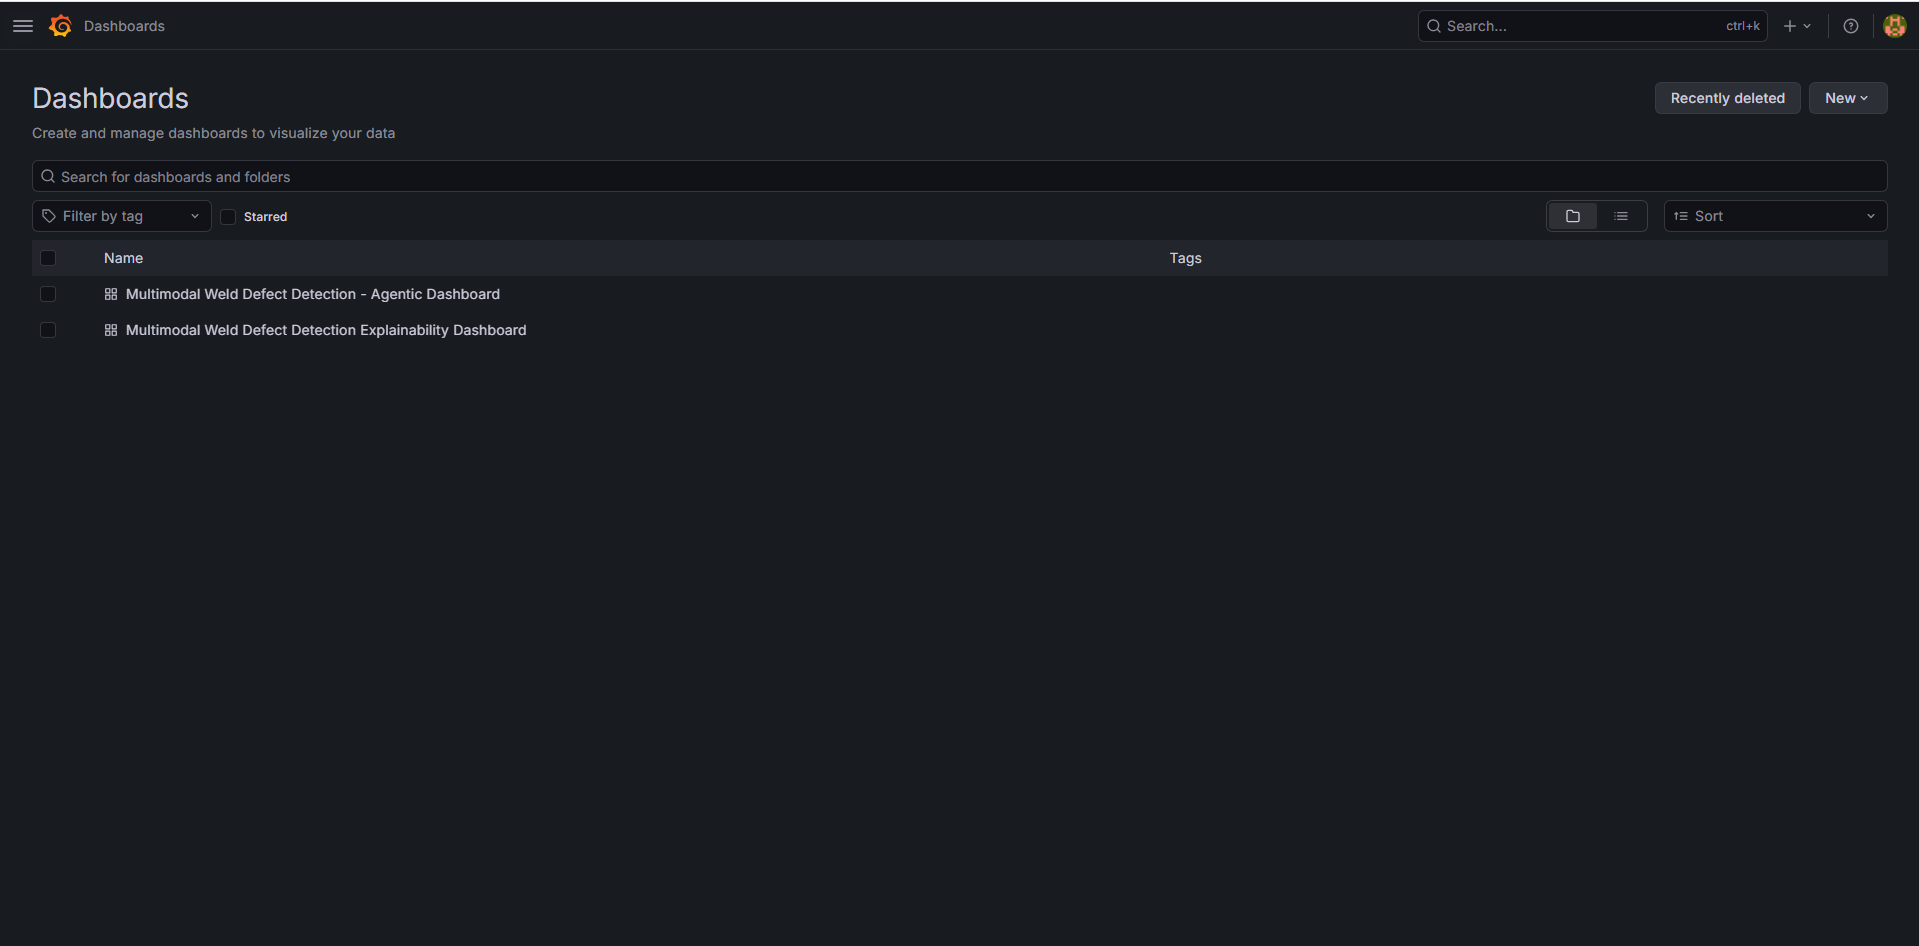
The following pages appear:
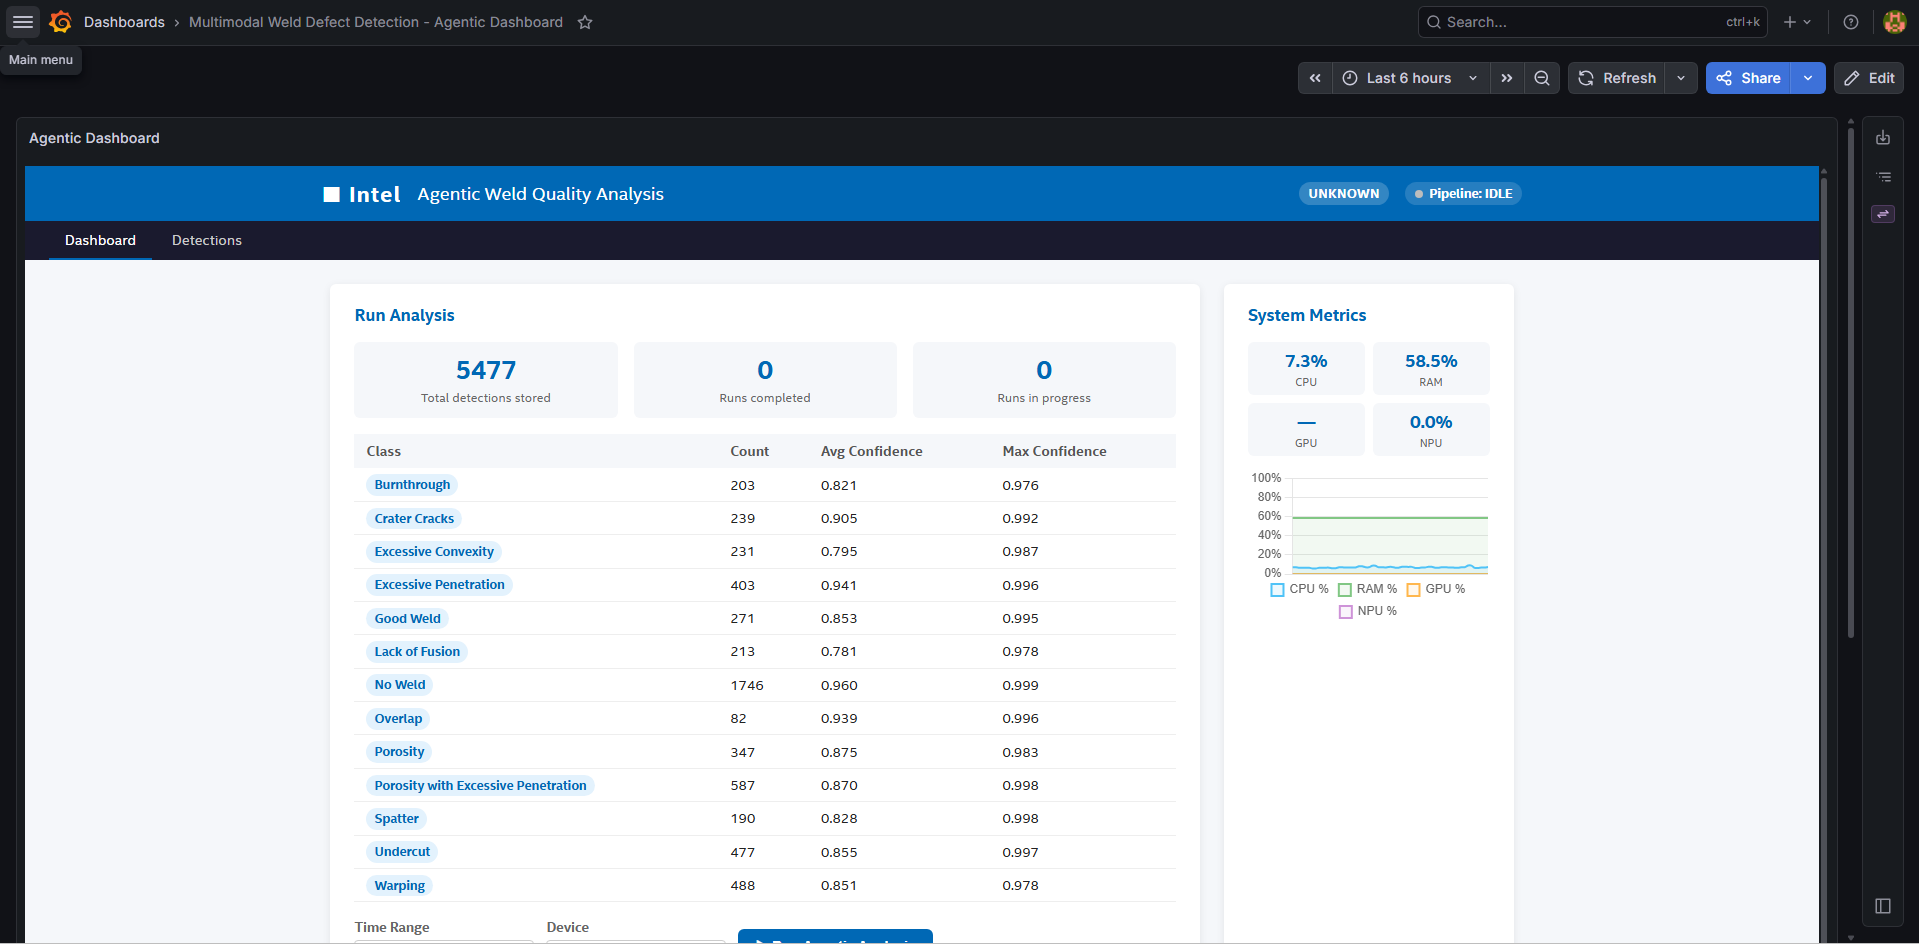
Results of the multi-agent pipeline appear:
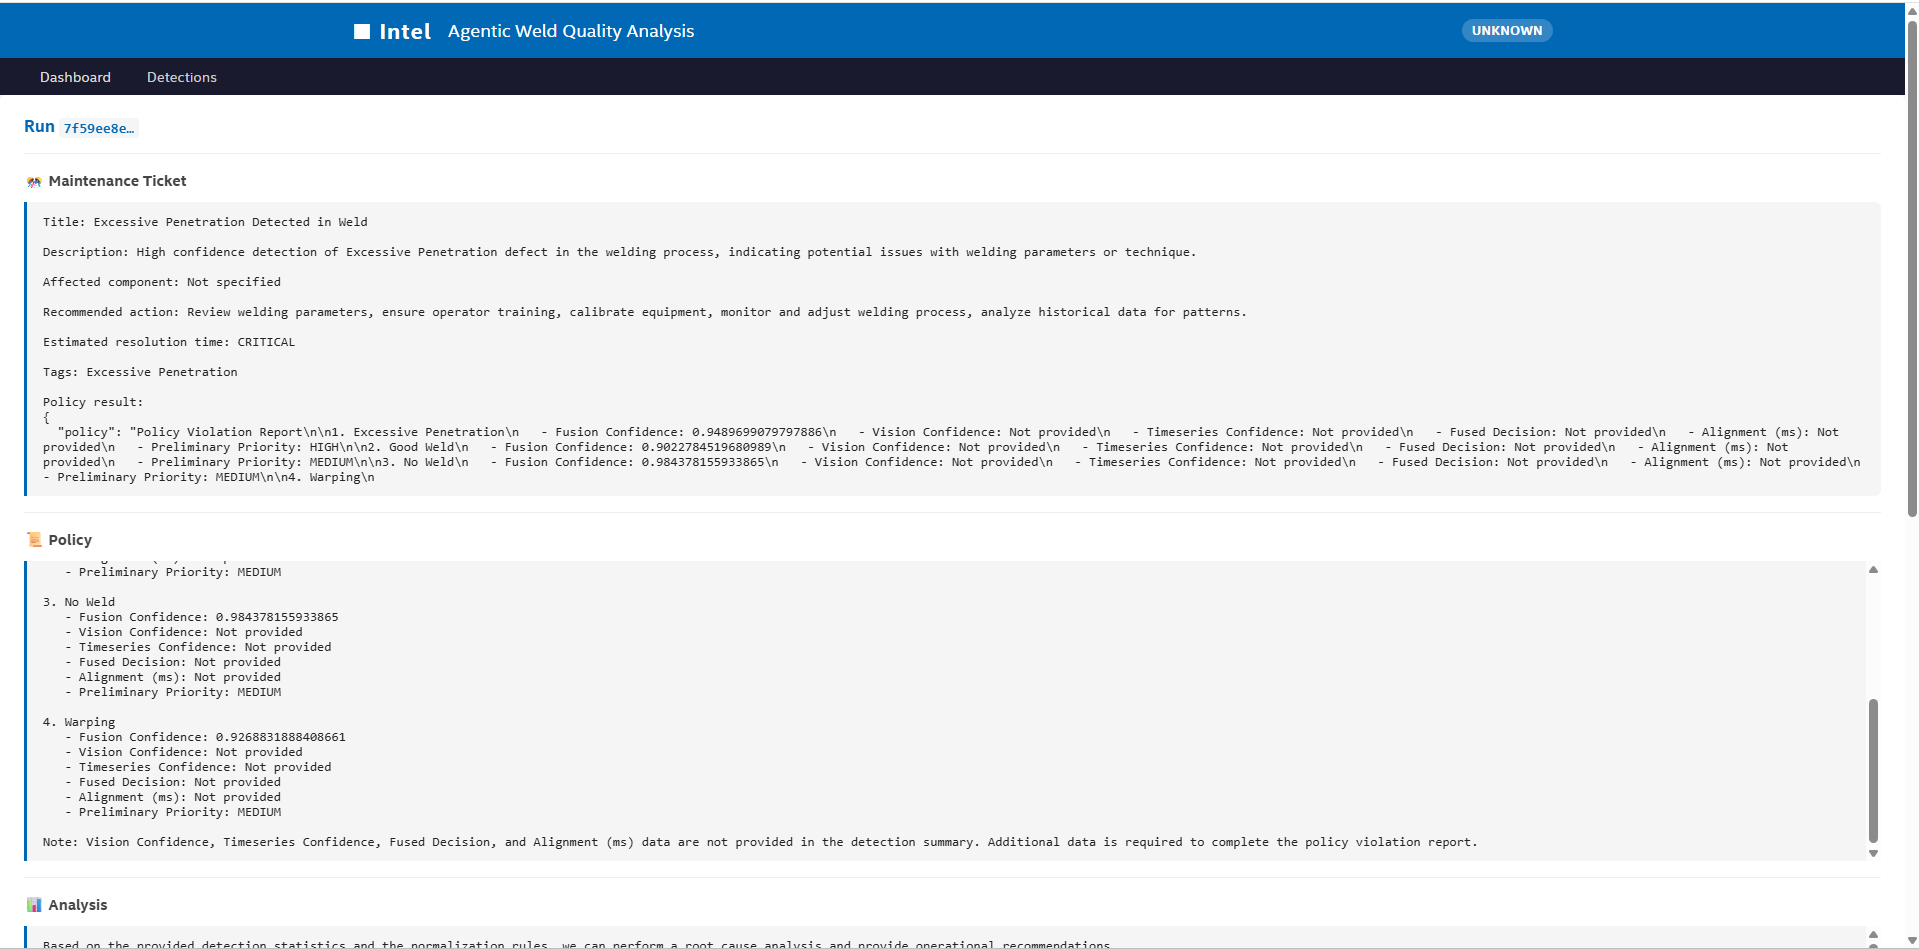
The detections dashboard appears:
Stop the Stack#
cd edge-ai-suites/manufacturing-ai-suite/industrial-edge-insights-multimodal
make down