Weld Anomaly Detection#
This sample app demonstrates how AI-driven analytics enable edge devices to monitor weld quality. It detects anomalous weld patterns and alerts operators for timely intervention, ensuring proactive maintenance, safety, and operational efficiency. No more failures and unplanned downtime.
In this article, you can learn about the architecture of the sample and its data flow.
If you want to start working with it, instead, check out the Get Started Guide or How-to Guides for Time-series applications.
App Architecture#
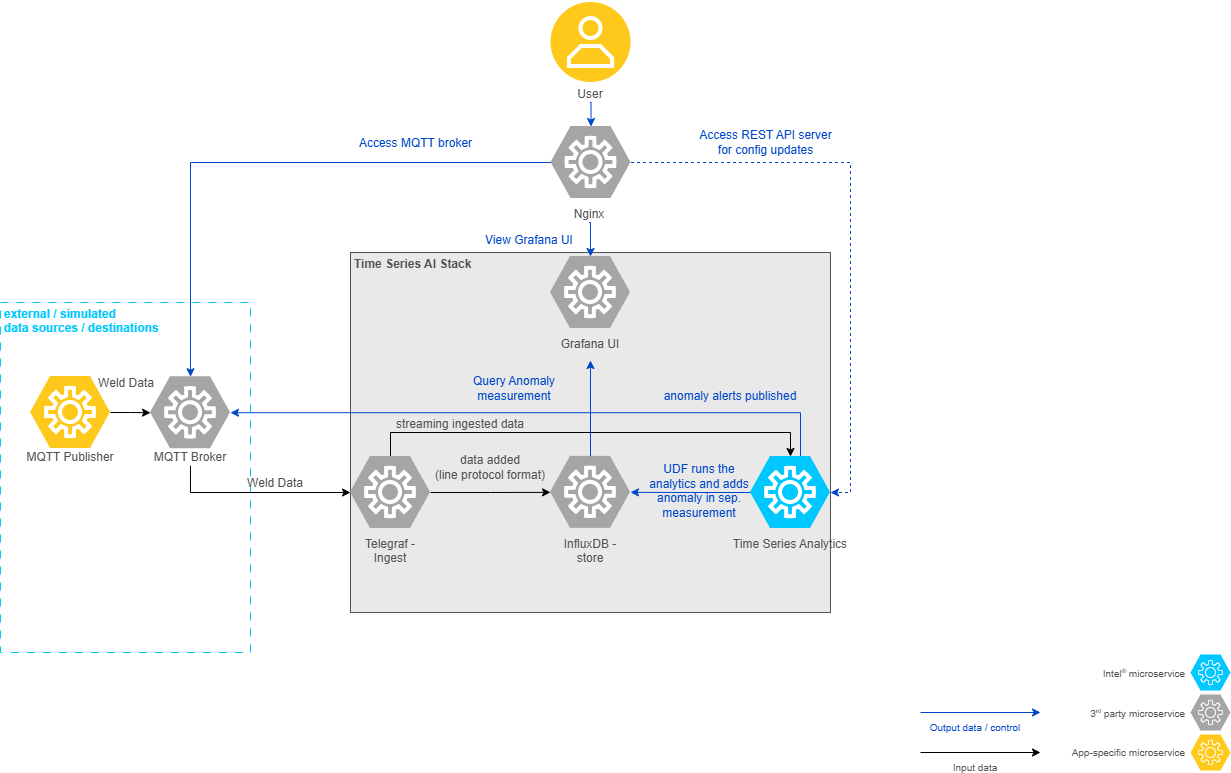
As seen in the following architecture diagram, the sample app at a high-level comprises of data simulators(can act as data destinations if configured) - these in the real world would be the physical devices, the generic Time Series AI stack based on TICK Stack comprising of Telegraf, InfluxDB, Time Series Analytics microservice using Kapacitor and Grafana.

Data flow explanation#
Let’s discuss how this architecture translates to data flow in the weld anomaly detection use case, by ingesting the data using the MQTT publisher simulator and publishing the anomaly alerts to MQTT broker.
Data Sources#
Simulation data in CSV format from edge-ai-suites/manufacturing-ai-suite/industrial-edge-insights-time-series/apps/weld-anomaly-detection/simulation-data is ingested into Telegraf using the MQTT protocol using the MQTT publisher data simulator.
Data Ingestion#
Telegraf through its input plugins MQTT gathers the data and sends this input data to both InfluxDB and Time Series Analytics Microservice.
Data Storage#
InfluxDB stores the incoming data coming from Telegraf.
Data Processing#
Time Series Analytics Microservice uses the User Defined Function(UDF) deployment package(TICK Scripts, UDFs, Models) coming from the sample apps. The UDF deployment package for Weld Anomaly Detection sample app is available at edge-ai-suites/manufacturing-ai-suite/industrial-edge-insights-time-series/apps/weld-anomaly-detection/time-series-analytics-config.
Directory details is as below:
config.json#
The task section defines the settings for the Kapacitor task and User-Defined Functions (UDFs).
Key |
Description |
Example Value |
|---|---|---|
|
Configuration for the User-Defined Functions (UDFs). |
See below for details. |
UDFs Configuration:
The udfs section specifies the details of the UDFs used in the task.
Key |
Description |
Example Value |
|---|---|---|
|
The name of the UDF script. |
|
|
The name of the model file used by the UDF. |
|
Note: The maximum allowed size for
config.jsonis 5 KB.
Alerts Configuration:
The alerts section defines the settings for alerting over MQTT protocol.
MQTT Configuration:
The mqtt section specifies the MQTT broker details for sending alerts.
Key |
Description |
Example Value |
|---|---|---|
|
The hostname or IP address of the MQTT broker. |
|
|
The port number of the MQTT broker. |
|
|
The name of the MQTT broker configuration. |
|
udfs/#
Contains the python script to process the incoming data. Uses CatBoostClassifier machine learning algo from CatBoost library to run on CPU to detect the anomalous power generation data points relative to wind speed.
Note: Please note, CatBoost models doesn’t run on Intel GPUs.
tick_scripts/#
The TICKScript weld_anomaly_detector.tick determines processing of the input data coming in.
Mainly, has the details on execution of the UDF file, storage of processed data and publishing of alerts.
By default, it is configured to publish the alerts to MQTT.
models/#
The weld_anomaly_detector.cb is a model built using the CatBoostClassifier Algo of CatBoost ML
library.