Weld Defect Detection#
App Architecture#

Data flow explanation#
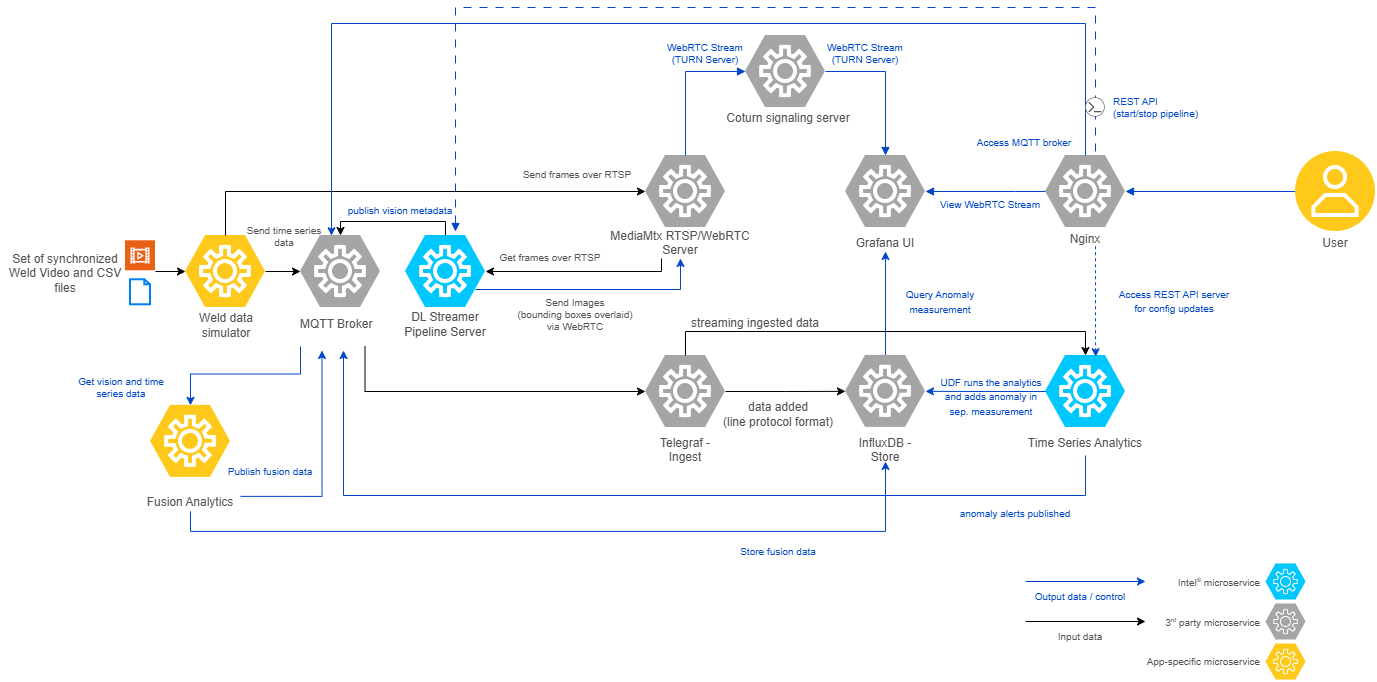
As seen in the architecture diagram above, the sample app at a high-level comprises of data simulator, analytics and visualization components. Let’s discuss how this architecture translates to data flow in the weld defect detection use case.
1. Weld Data Simulator#
The Weld Data Simulator uses sets of time synchronized .avi and .csv files from the edge-ai-suites/manufacturing-ai-suite/industrial-edge-insights-multimodal/weld-data-simulator/simulation-data/ subset of test dataset coming from Intel_Robotic_Welding_Multimodal_Dataset.
It ingests the .avi files as RTSP streams via the mediamtx server. This enables real-time video ingestion, simulating camera feeds for weld defect detection.
Similarly, it ingests the .csv files as data points into Telegraf using the MQTT protocol.
2. Analytics Modules#
2.1 DL Streamer Pipeline Server#
The DL Streamer Pipeline Server microservice reads the frames/images from the MediaMTX server over RTSP protocol, runs the configured DL weld
defect classification model, publishes the frame metadata results over MQTT and generates the WebRTC stream with bounded boxes for visualization in Grafana.
DL Streamer Pipeline Server config.json#
Pipeline Configuration:
Key |
Description |
Example Value |
|---|---|---|
|
The name of the pipeline configuration. |
|
|
The source type for video ingestion. |
|
|
Maximum size of the queue for processing frames. |
|
|
GStreamer pipeline string defining the video processing flow from RTSP source through classification to output. |
|
|
Configuration parameters for pipeline elements, specifically for the classification element properties. |
See below for nested structure |
Parameters Properties:
Key |
Description |
Value |
|---|---|---|
|
Properties for the classification element in the pipeline. |
Object containing element configuration |
|
Name of the GStreamer element to configure. |
|
|
Format type for element properties. |
|
Destination Configuration:
Key |
Description |
Example Value |
|---|---|---|
|
Configuration for output destinations of the pipeline. |
Object containing metadata and frame settings |
|
The protocol type for sending metadata information. |
|
|
The MQTT topic where vision classification results are published. |
|
|
The protocol type for streaming video frames. |
|
|
Unique identifier for the WebRTC peer connection. |
|
2.2 Time Series Analytics Microservice#
Time Series Analytics Microservice uses Kapacitor - a real-time data processing engine that enables users to analyze time series data. It reads the weld sensor data points point by point coming from Telegraf, runs the ML CatBoost model to identify the anomalies, writes the results into configured measurement/table in InfluxDB and publishes anomalous data over MQTT. Also, publishes all the processed weld sensor data points over MQTT.
The UDF deployment package used for
weld data is available
at edge-ai-suites/manufacturing-ai-suite/industrial-edge-insights-multimodal/config/time-series-analytics-microservice. Directory details is as below:
config.json#
UDFs Configuration:
The udfs section specifies the details of the UDFs used in the task.
Key |
Description |
Example Value |
|---|---|---|
|
The name of the UDF script. |
|
|
The name of the model file used by the UDF. |
|
Note: The maximum allowed size for
config.jsonis 5 KB.
Alerts Configuration:
The alerts section defines the settings for alerting mechanisms, such as MQTT protocol.
MQTT Configuration:
The mqtt section specifies the MQTT broker details for sending alerts.
Key |
Description |
Example Value |
|---|---|---|
|
The hostname or IP address of the MQTT broker. |
|
|
The port number of the MQTT broker. |
|
|
The name of the MQTT broker configuration. |
|
udfs/#
Contains the python script to process the incoming data. Uses CatBoostClassifier machine learning algorithm from the CatBoost library to run on CPU to detect anomalous weld data points using sensor data.
Note: Please note, CatBoost models doesn’t run on Intel GPUs.
tick_scripts/#
The TICKScript weld_anomaly_detector.tick determines processing of the input data coming in.
Mainly, has the details on execution of the UDF file, storage of processed data and publishing of alerts.
By default, it is configured to publish the alerts to MQTT.
models/#
The weld_anomaly_detector.cb is a model built using the CatBoostClassifier Algo of CatBoost ML
library.
2.3 Fusion Analytics#
Fusion Analytics subscribes to the MQTT topics coming out of DL Streamer Pipeline Server and Time Series Analytics Microservice, applies AND/OR logic to determine the anomalies during weld process, publishes the results over MQTT and writes the results as a measurement/table in InfluxDB
3. Data Storage#
InfluxDB stores the incoming data coming from Telegraf, Time Series Analytics Microservice and Fusion Analytics .
4. Data Visualization#
Grafana provides an intuitive user interface for visualizing time series data stored in InfluxDB and also rendering the output of DL Streamer Pipeline Server coming as WebRTC stream. Additionally, it visualizes the fusion analytics results stored in InfluxDB.
Summary#
This section provides an overview of the architecture for the Multimodal Weld Defect Detection sample app. Refer to the detailed instructions in Get Started.