Get Started#
Time to Complete: 30 minutes
Programming Language: Python 3
Configure Docker#
To configure Docker:
Run Docker as Non-Root: Follow the steps in Manage Docker as a non-root user.
Configure Proxy (if required):
Set up proxy settings for Docker client and containers as described in Docker Proxy Configuration.
Example
~/.docker/config.json:{ "proxies": { "default": { "httpProxy": "http://<proxy_server>:<proxy_port>", "httpsProxy": "http://<proxy_server>:<proxy_port>", "noProxy": "127.0.0.1,localhost" } } }
Configure the Docker daemon proxy as per Systemd Unit File.
Enable Log Rotation:
Add the following configuration to
/etc/docker/daemon.json:{ "log-driver": "json-file", "log-opts": { "max-size": "10m", "max-file": "5" } }
Reload and restart Docker:
sudo systemctl daemon-reload
sudo systemctl restart docker
Clone source code#
Go to the target directory of your choice and clone the suite.
If you want to clone a specific release branch, replace main with the desired tag.
To learn more on partial cloning, check the Repository Cloning guide.
git clone --filter=blob:none --sparse --branch release-2026.1.0 https://github.com/open-edge-platform/edge-ai-suites.git
cd edge-ai-suites
git sparse-checkout set manufacturing-ai-suite
cd manufacturing-ai-suite/industrial-edge-insights-time-series
Deploy with Docker Compose#
Update the following fields in
.env:INFLUXDB_USERNAMEINFLUXDB_PASSWORDVISUALIZER_GRAFANA_USERVISUALIZER_GRAFANA_PASSWORD
Deploy the sample app, use only one of the following options:
NOTE:
The below
make up_opcua_ingestionormake up_mqtt_ingestionfails if the above required fields are not populated as per the rules called out in.envfile.The sample app is deployed by pulling the pre-built container images of the sample app from the docker hub OR from the internal container registry (login to the docker registry from cli and configure
DOCKER_REGISTRYenv variable in.envfile atedge-ai-suites/manufacturing-ai-suite/industrial-edge-insights-time-series)The
CONTINUOUS_SIMULATOR_INGESTIONvariable in the.envfile (for Docker Compose) and inhelm/values.yaml(for Helm deployments) is set totrueby default, enabling continuous looping of simulator data. To ingest the simulator data only once (without looping), set this variable tofalse.If
CONTINUOUS_SIMULATOR_INGESTIONis set tofalse, you may see the[inputs.opcua] status not OK for nodemessage in thetelegraflogs for OPC-UA ingestion after a single data ingestion loop. This message can be ignored.
make up_opcua_ingestionis supported only forWind Turbine Anomaly Detectionsample app
Using OPC-UA ingestion:
make up_opcua_ingestion app="wind-turbine-anomaly-detection"
Using MQTT ingestion:
make up_mqtt_ingestion app="wind-turbine-anomaly-detection"
make up_mqtt_ingestion app="weld-defect-detection"
Running User Defined Function(UDF) inference on GPU#
By default, UDF for both the sample apps is configured to run on CPU.
To trigger the UDF inference on GPU in Time Series Analytics Microservice, run the following command:
For Wind Turbine Anomaly Detection:
cd edge-ai-suites/manufacturing-ai-suite/industrial-edge-insights-time-series/apps/wind-turbine-anomaly-detection/time-series-analytics-config
curl -k -X 'POST' \
 'https://localhost:3000/ts-api/config' \
 -H 'accept: application/json' \
 -H 'Content-Type: application/json' \
 -d "$(sed 's/"device": "CPU"/"device": "GPU"/' config.json)"
For Weld Defect Detection:
cd edge-ai-suites/manufacturing-ai-suite/industrial-edge-insights-time-series/apps/weld-defect-detection/time-series-analytics-config
curl -k -X 'POST' \
 'https://localhost:3000/ts-api/config' \
 -H 'accept: application/json' \
 -H 'Content-Type: application/json' \
 -d "$(sed 's/"device": "CPU"/"device": "GPU"/' config.json)"
Verify the Output Results#
Get into the InfluxDB* container:
Note: Use
kubectl exec -it <influxdb-pod-name> -n <namespace> -- /bin/bashfor the Helm deployment where forreplace with namespace name where the application was deployed and for replace with InfluxDB pod name. docker exec -it ia-influxdb bash
Run the following commands to see the data in InfluxDB*:
NOTE: Please ignore the error message
There was an error writing history file: open /.influx_history: read-only file systemhappening in the InfluxDB shell. This does not affect any functionality while working with the InfluxDB commands# For below command, the INFLUXDB_USERNAME and INFLUXDB_PASSWORD needs to be fetched from `.env` file # for docker compose deployment and `values.yml` for helm deployment influx -username <username> -password <passwd> use datain # database access show measurements # Run below query to check and output measurement processed # by Time Series Analytics microservice select * from "wind-turbine-anomaly-data"
To check the output in Grafana:
Use link
https://<host_ip>:3000/to launch Grafana from browser (preferably Chrome browser)Note:: Use link
https://<host_ip>:30001to launch Grafana from browser (preferably Chrome browser) for the Helm deploymentLogin to the Grafana with values set for
VISUALIZER_GRAFANA_USERandVISUALIZER_GRAFANA_PASSWORDin.envfile.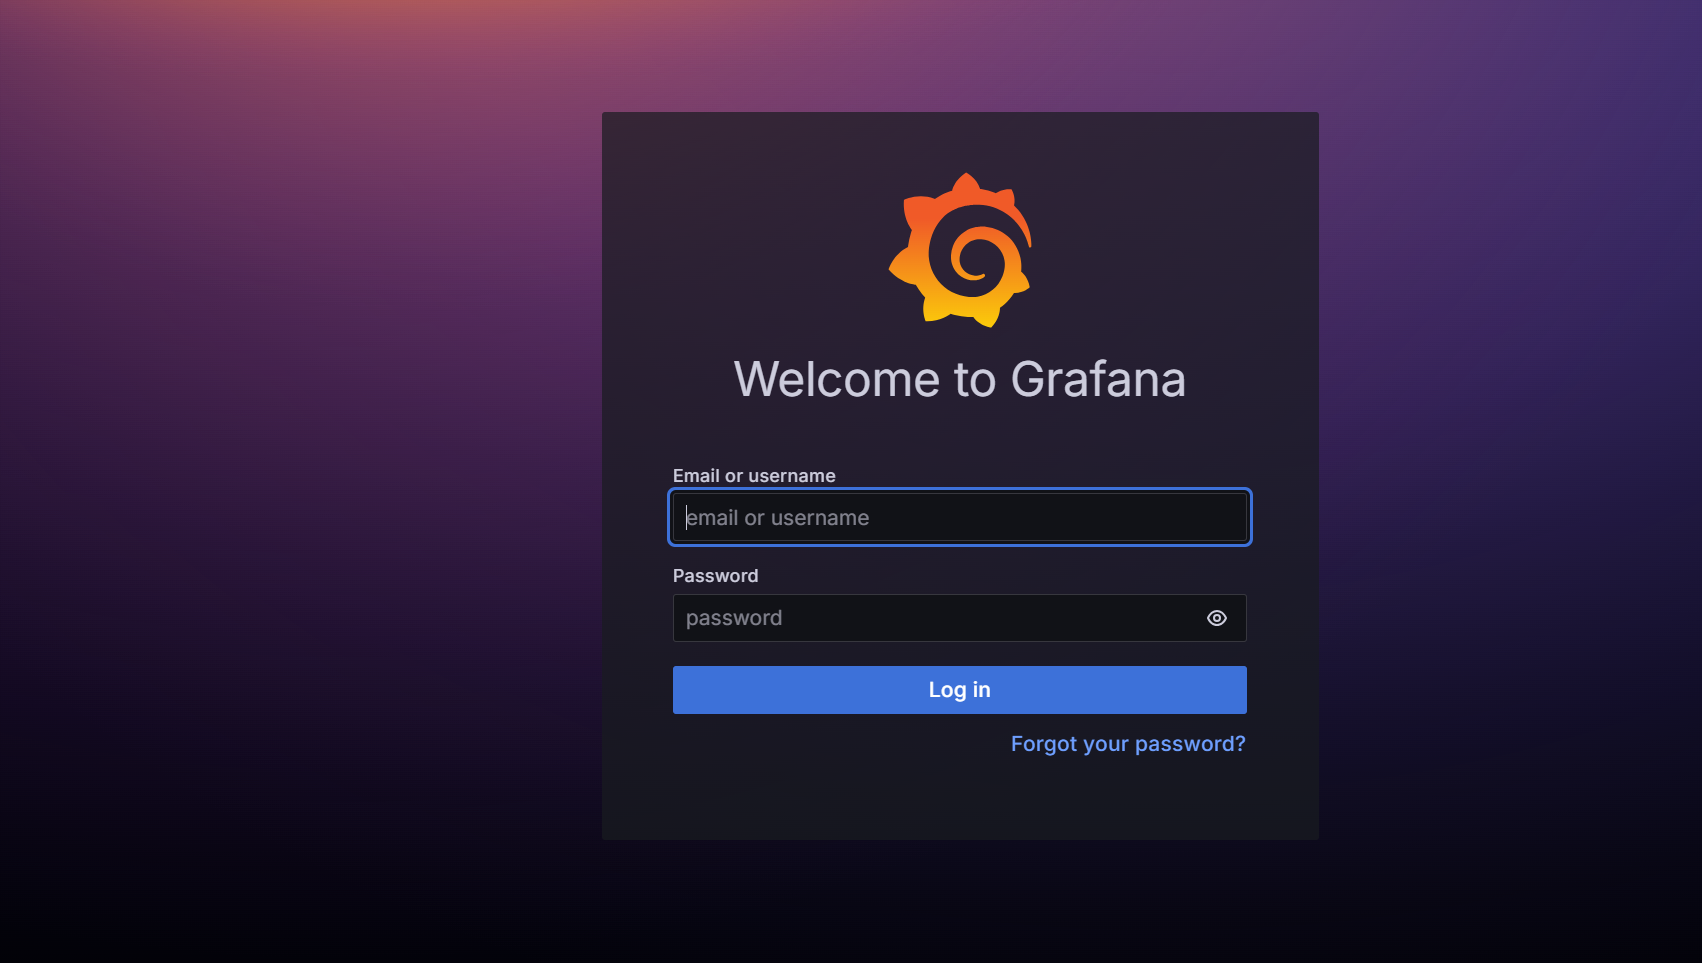
After login, click on Dashboard
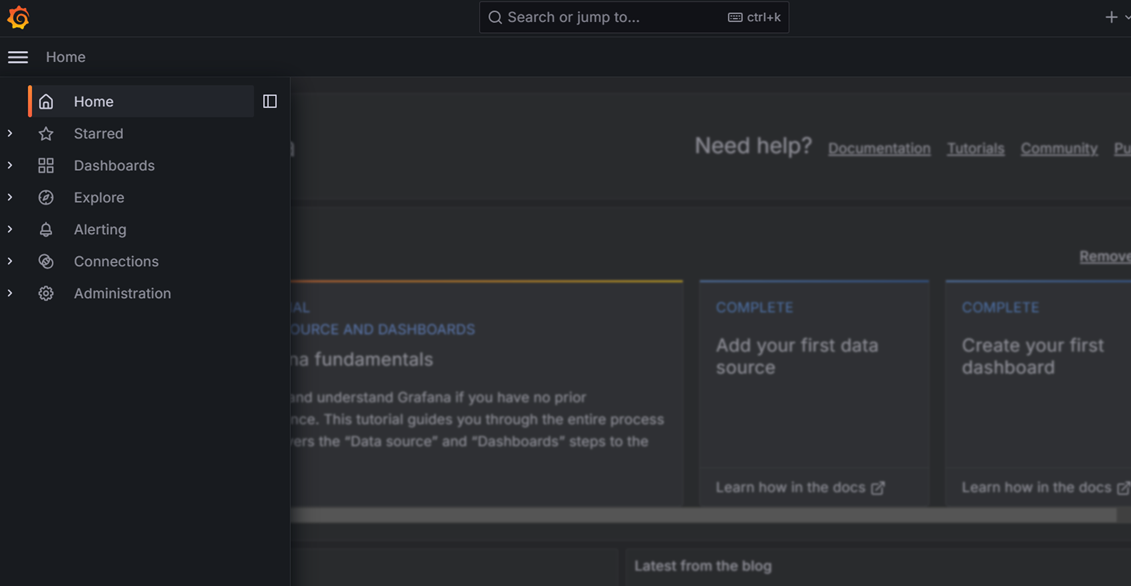
Select the
Wind Turbine Dashboard.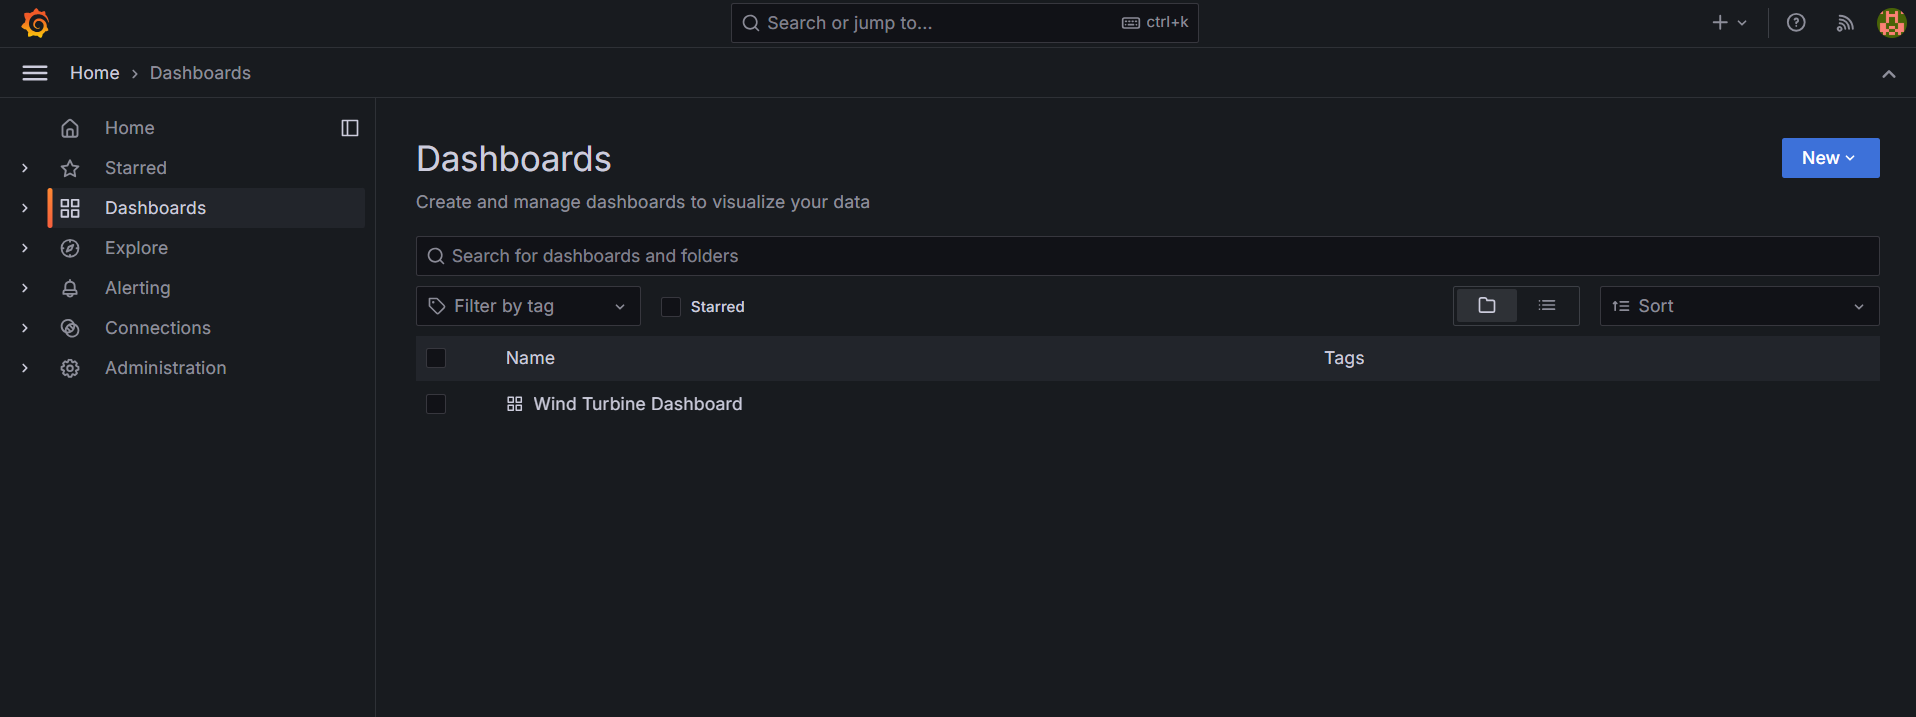
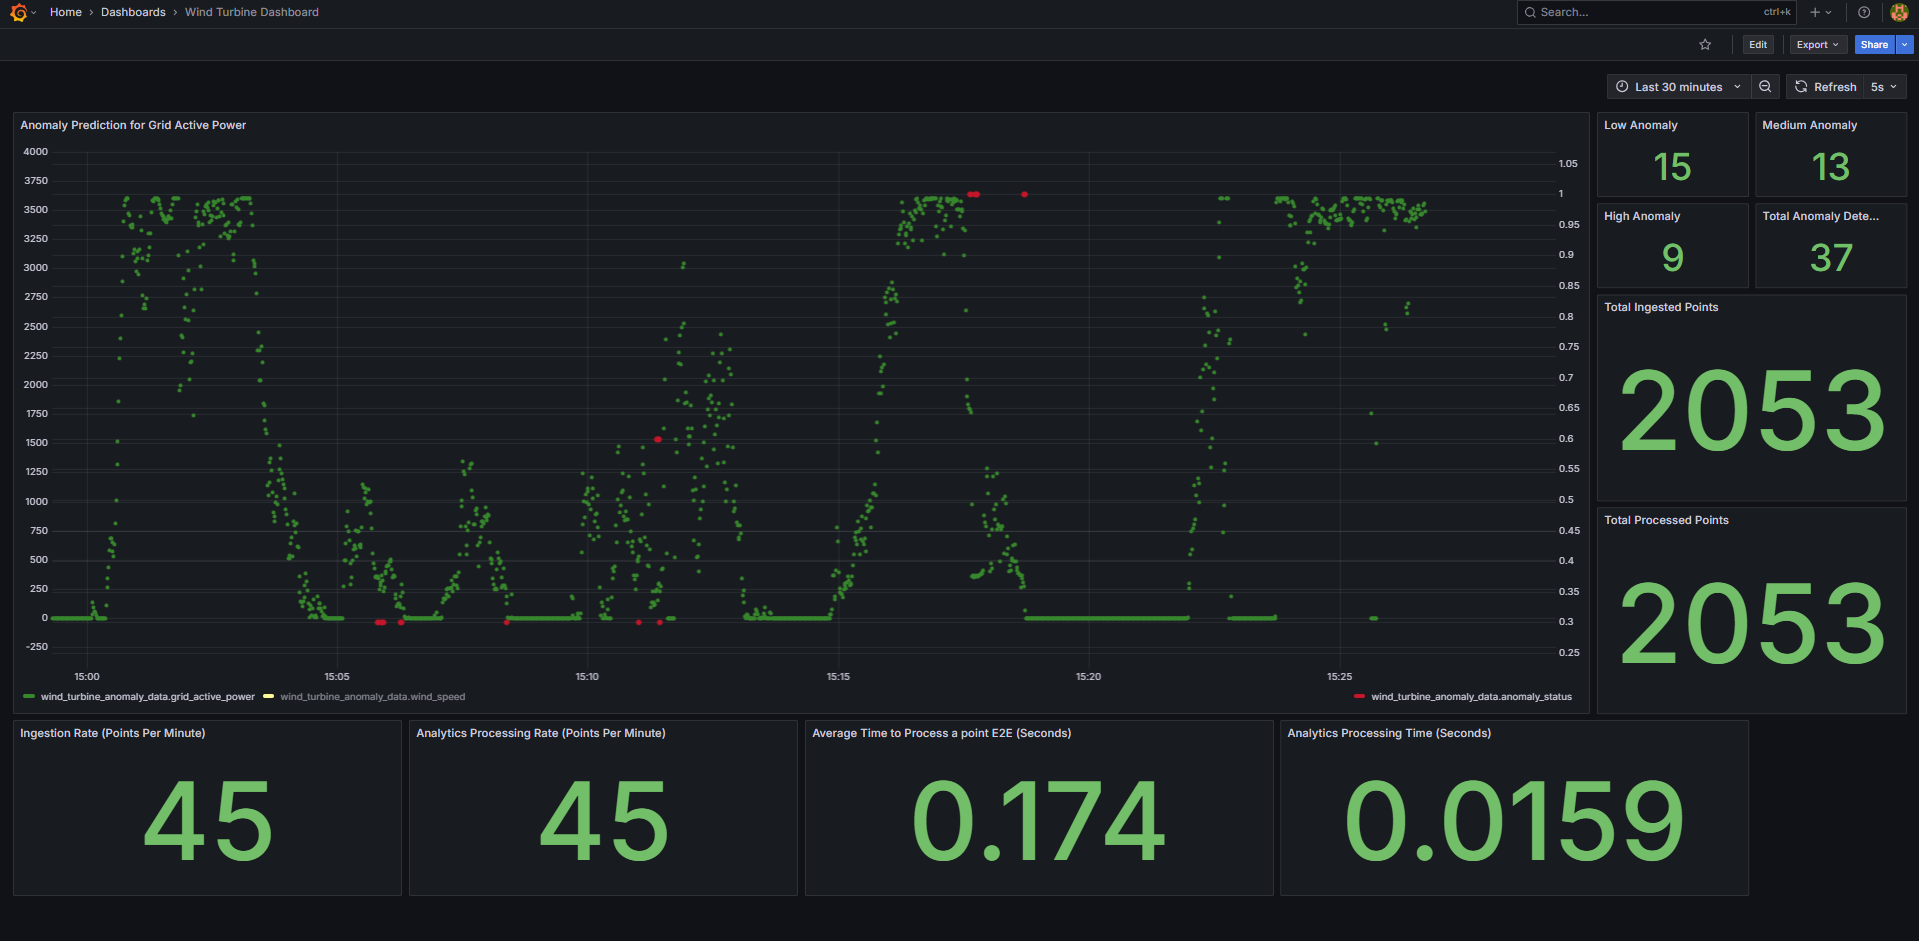
You will see the below output.
Get into the InfluxDB* container:
Note: Use
kubectl exec -it <influxdb-pod-name> -n <namespace> -- /bin/bashfor the Helm deployment where forreplace with namespace name where the application was deployed and for replace with InfluxDB pod name. docker exec -it ia-influxdb bash
Run following commands to see the data in InfluxDB*:
NOTE: Please ignore the error message
There was an error writing history file: open /.influx_history: read-only file systemhappening in the InfluxDB shell. This does not affect any functionality while working with the InfluxDB commands# For below command, the INFLUXDB_USERNAME and INFLUXDB_PASSWORD needs to be fetched from `.env` file # for docker compose deployment and `values.yml` for helm deployment influx -username <username> -password <passwd> use datain # database access show measurements # Run below query to check and output measurement processed # by Time Series Analytics microservice select * from "weld-sensor-anomaly-data"
To check the output in Grafana:
Use link
https://<host_ip>:3000/to launch Grafana from browser (preferably Chrome browser)Note: Use link
https://<host_ip>:30001to launch Grafana from browser (preferably Chrome browser) for the Helm deploymentLogin to the Grafana with values set for
VISUALIZER_GRAFANA_USERandVISUALIZER_GRAFANA_PASSWORDin.envfile.After login, click on Dashboard
Select the
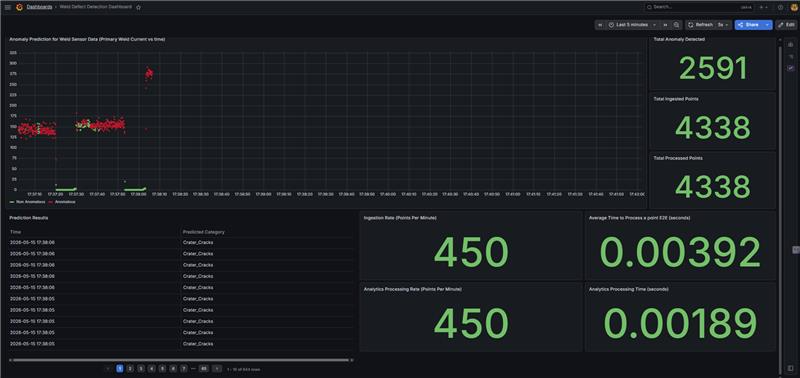
Weld Defect Detection Dashboard.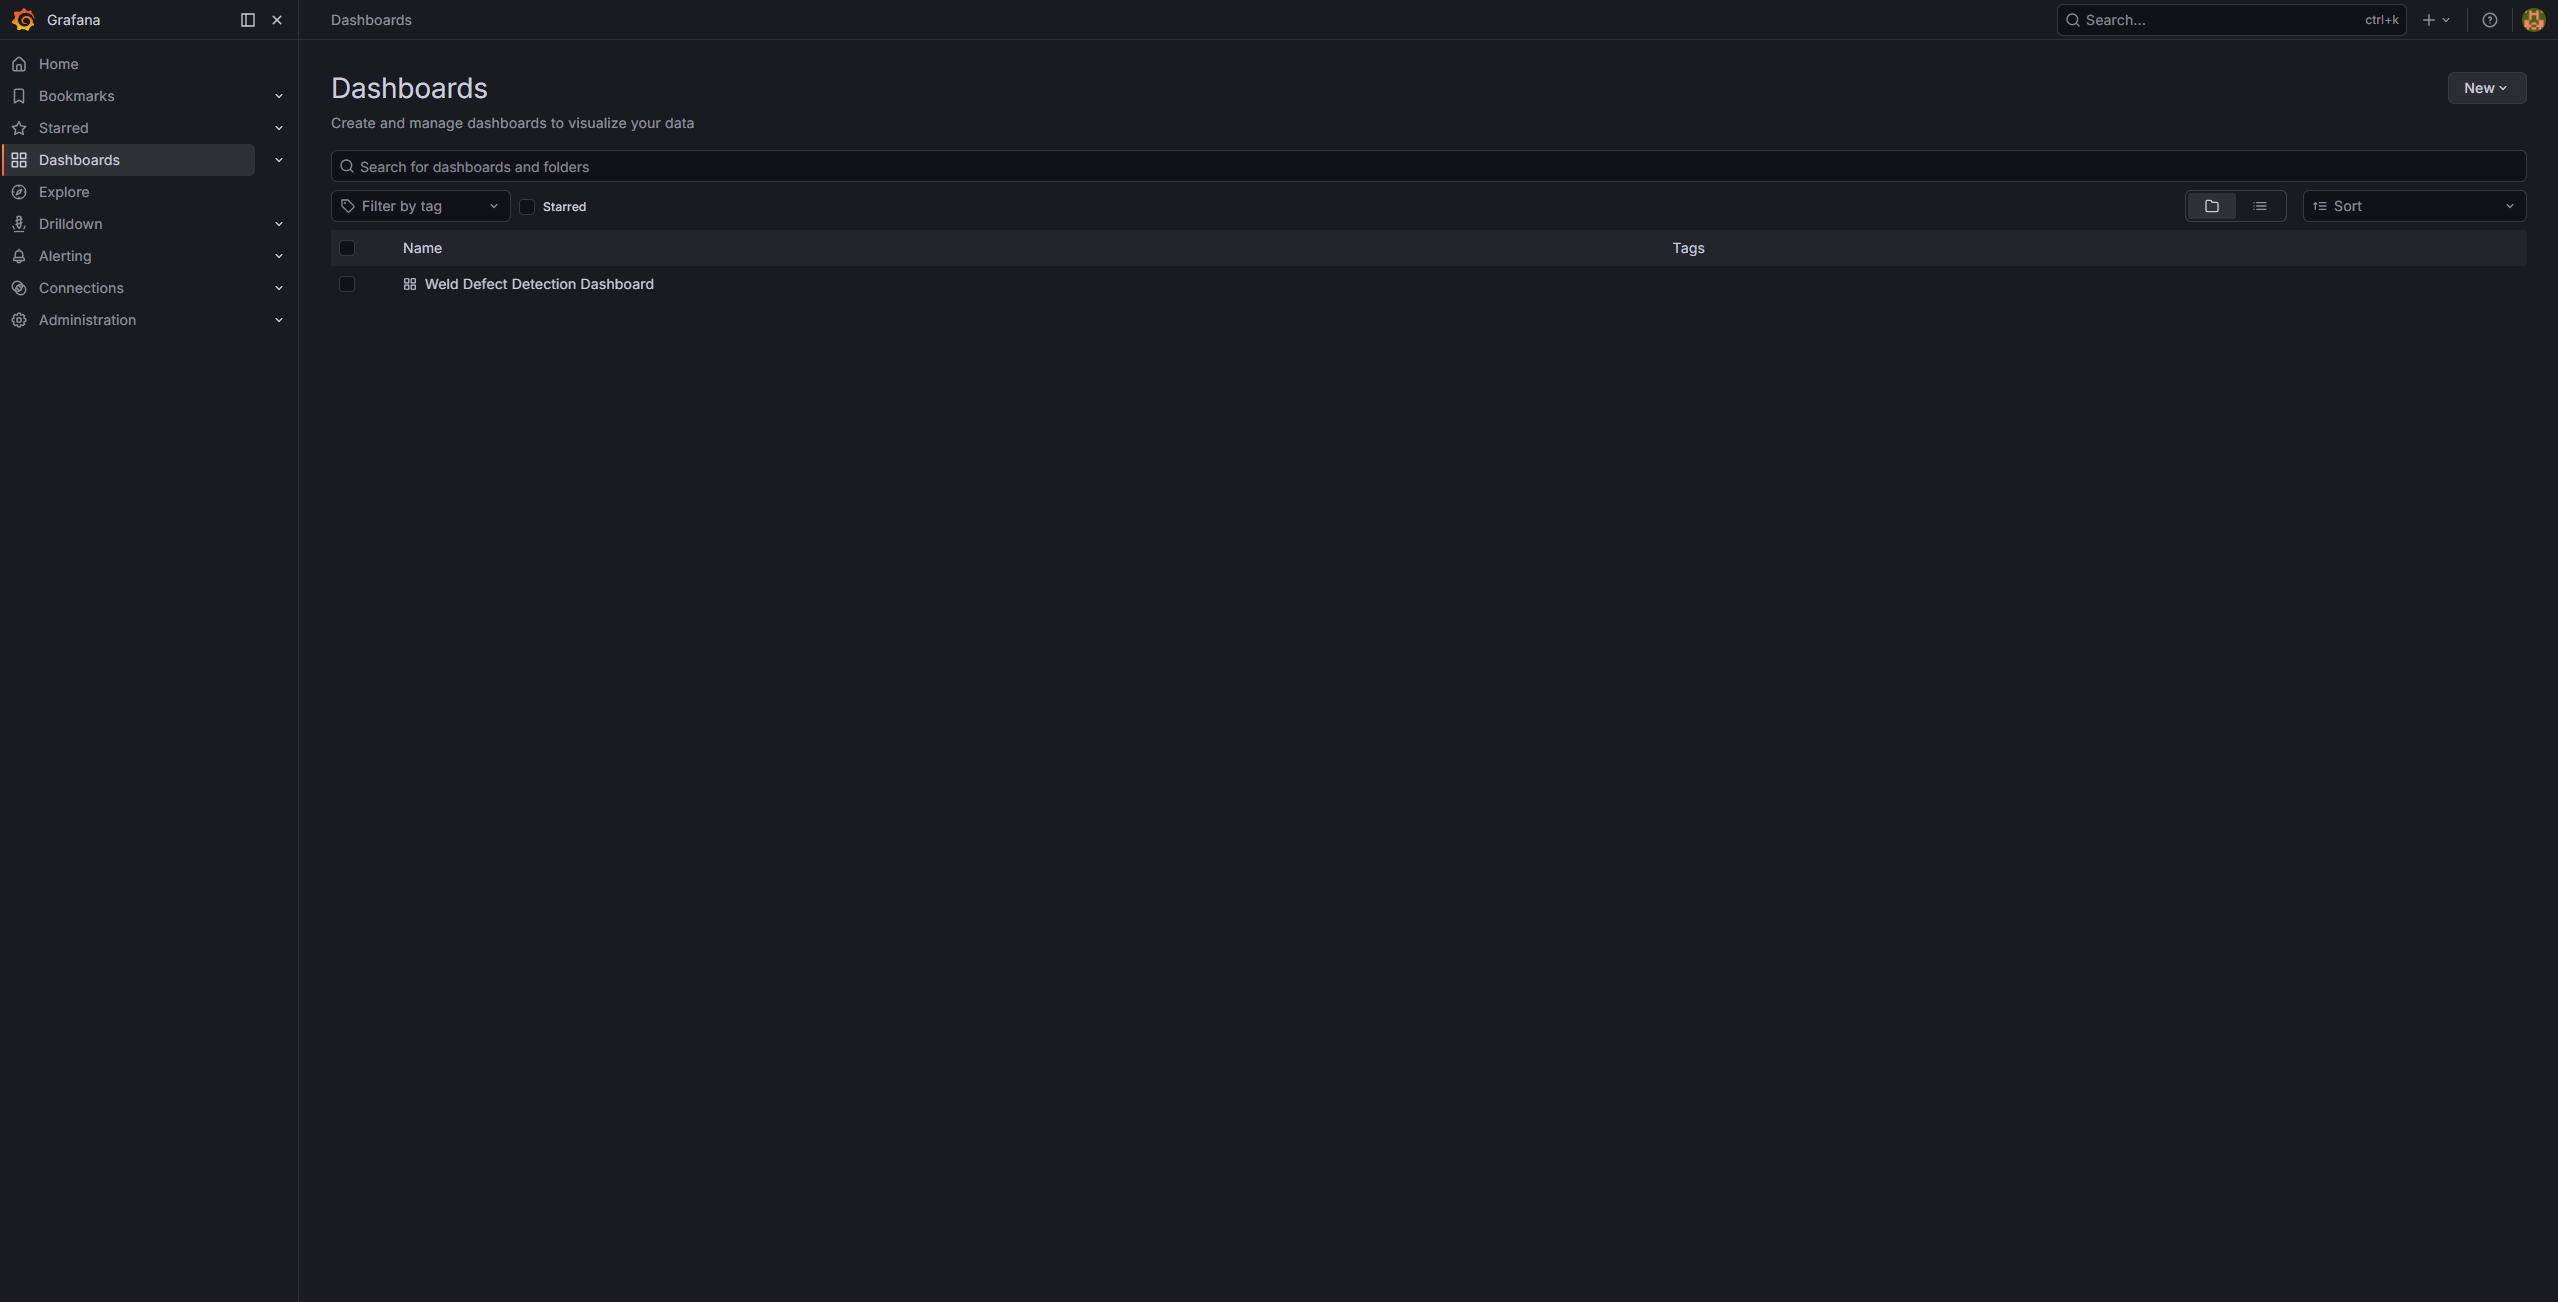
One will see the below output.
Bring down the sample app#
make down
Check logs - troubleshooting#
Check container logs to catch any failures:
docker ps
docker logs -f <container_name>
docker logs -f <container_name> | grep -i error
Other Deployment options#
See How to Deploy with Helm guide to learn how to deploy the sample application on a k8s cluster using Helm.
Advanced setup#
How to build from source and deploy: Guide to build from source and docker compose deployment
How to configure OPC-UA/MQTT alerts: Guide for configuring the OPC-UA/MQTT alerts in the Time Series Analytics microservice
How to configure custom UDF deployment package: Guide for deploying a customized UDF deployment package (UDFs/models/TICKscripts)
How to enable multi-stream ingestion: Guide to deploy sample apps with multiple parallel ingestion streams
How to run benchmarking: Guide to benchmark ingestion and UDF processing with stream and batch modes