Enable System Metrics Dashboard#
Note: The system metrics dashboard is only supported with docker compose deployments and requires
Telegrafto run as therootuser.
Please follow prerequisites and understand data flow explanation as a prerequisite.
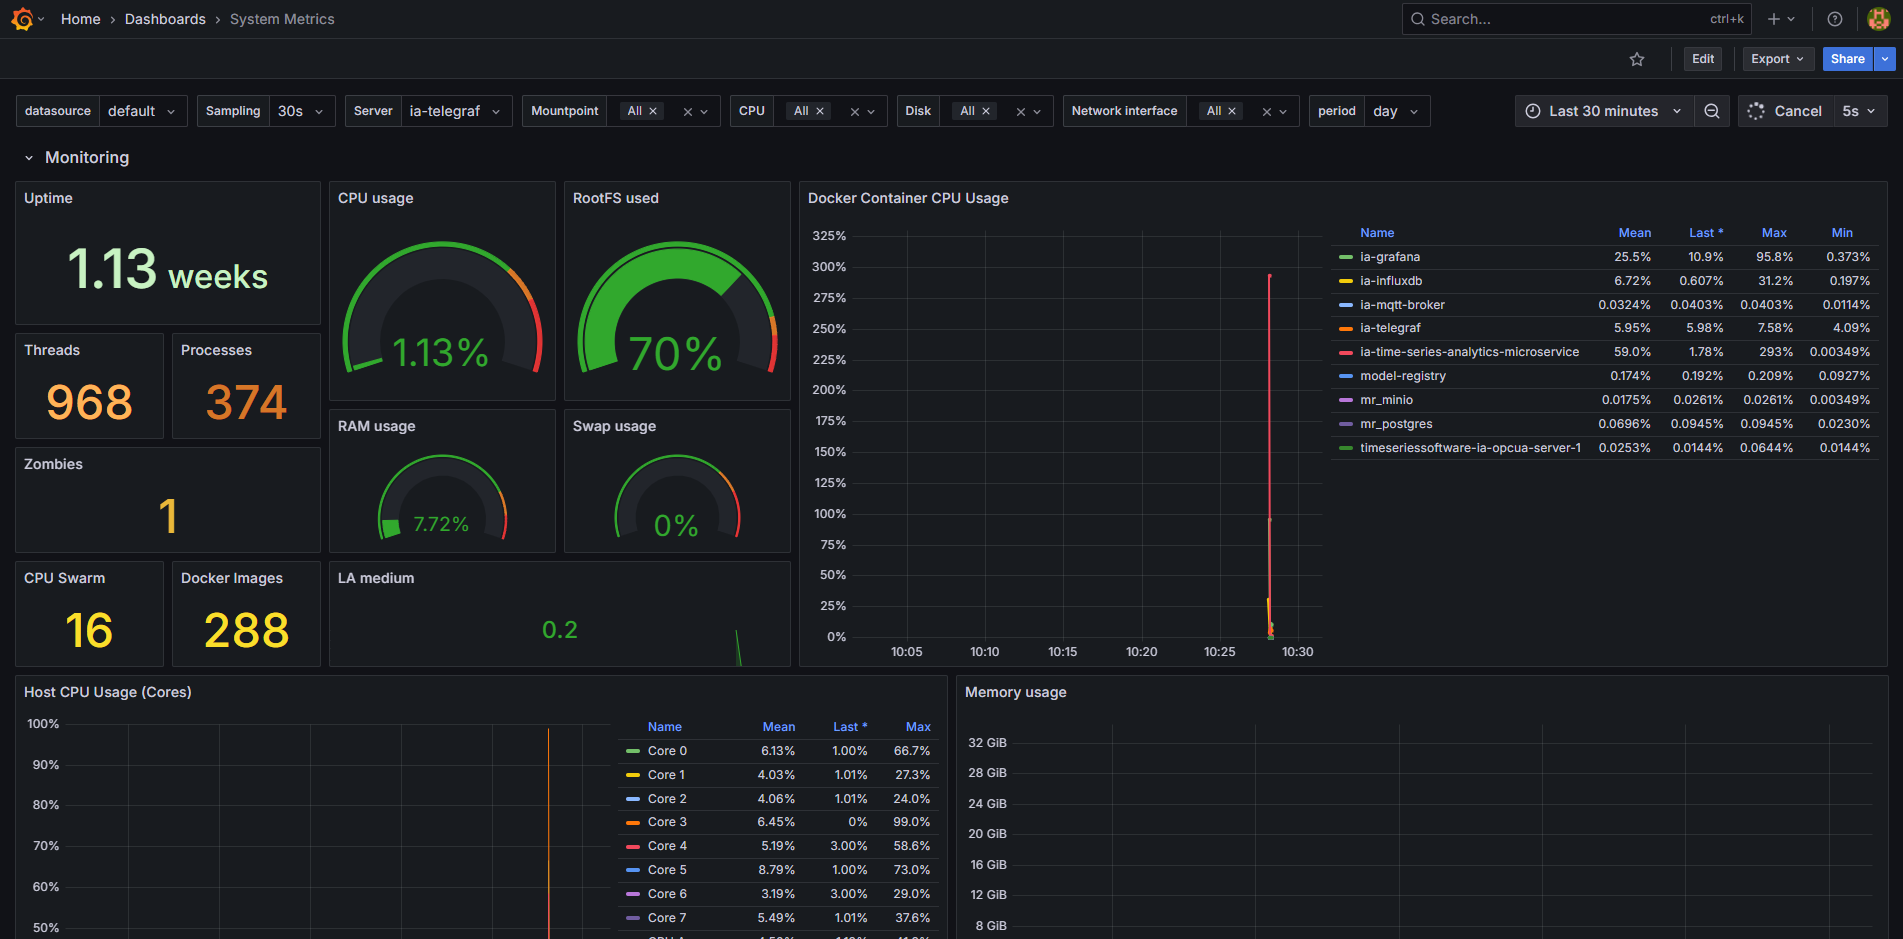
To enable the system metrics dashboard showcasing the host and docker containers CPU, memory, network, disk IO usage, run the following command:
cd edge-ai-suites/manufacturing-ai-suite/industrial-edge-insights-time-series/ # path relative to git clone folder
# Try one of the below options:
make up_opcua_ingestion INCLUDE=validation
# OR
make up_mqtt_ingestion INCLUDE=validation
Viewing System Metrics Dashboard#
Use link
https://<host_ip>:3000/to launch Grafana from browser (preferably, chrome browser)Login to the Grafana with values set for
VISUALIZER_GRAFANA_USERandVISUALIZER_GRAFANA_PASSWORDin.envfile and select System Metrics Dashboard.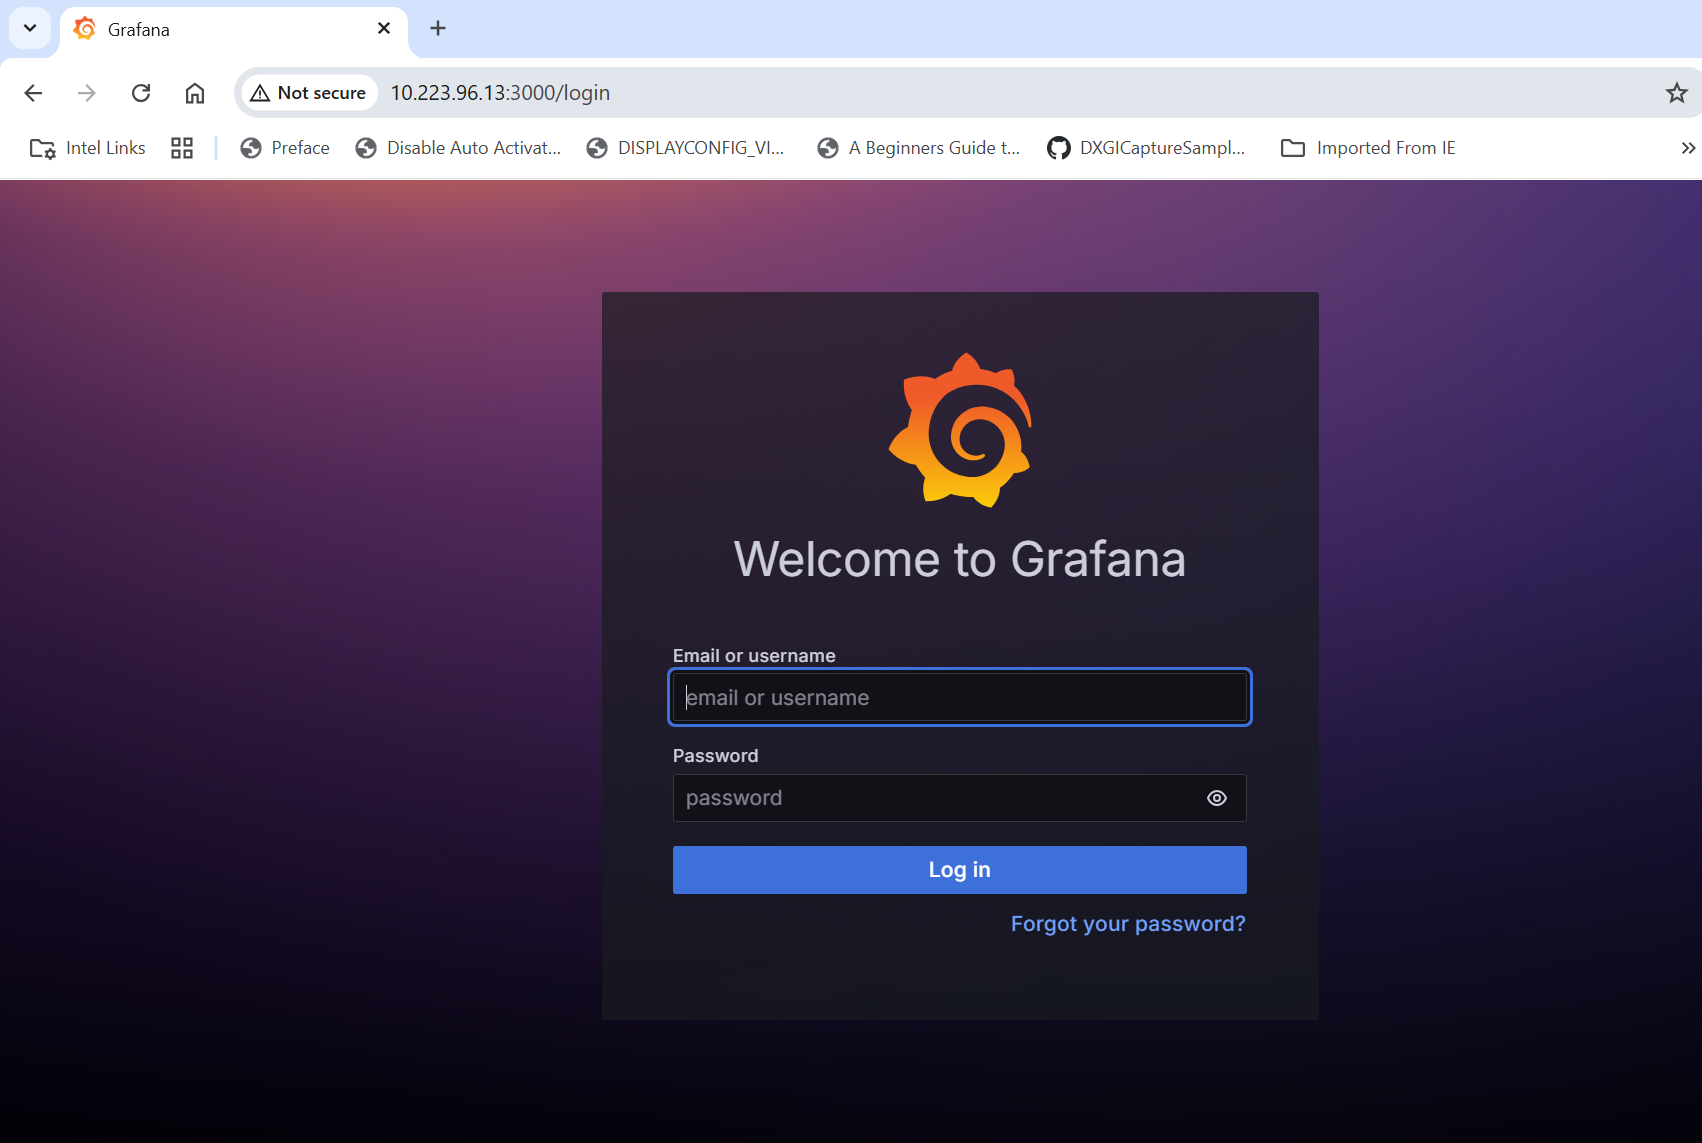
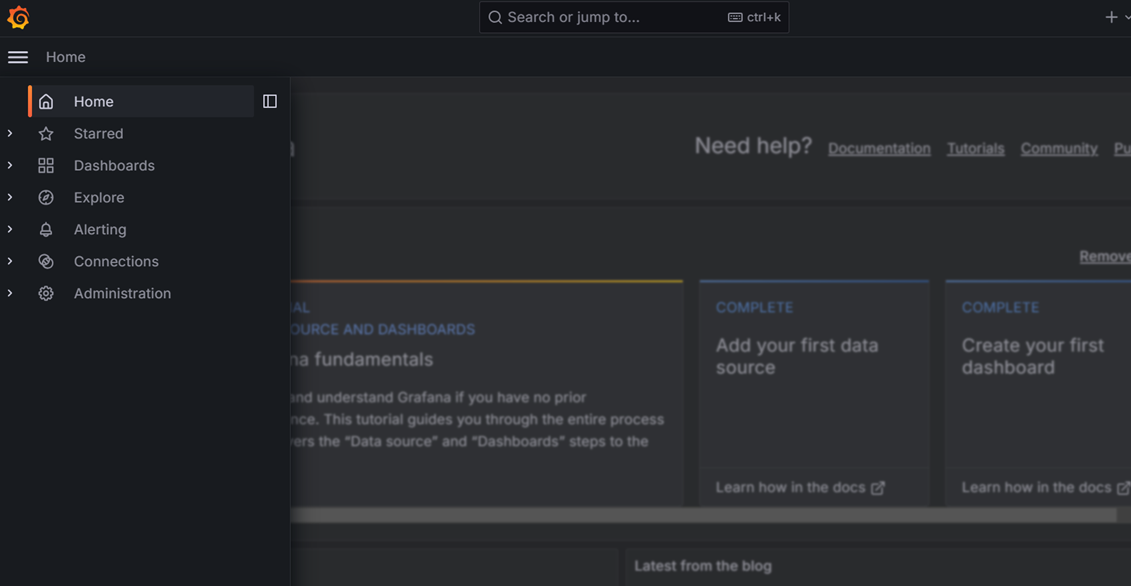
After login, click on Dashboard
Select the
System Metrics Dashboard.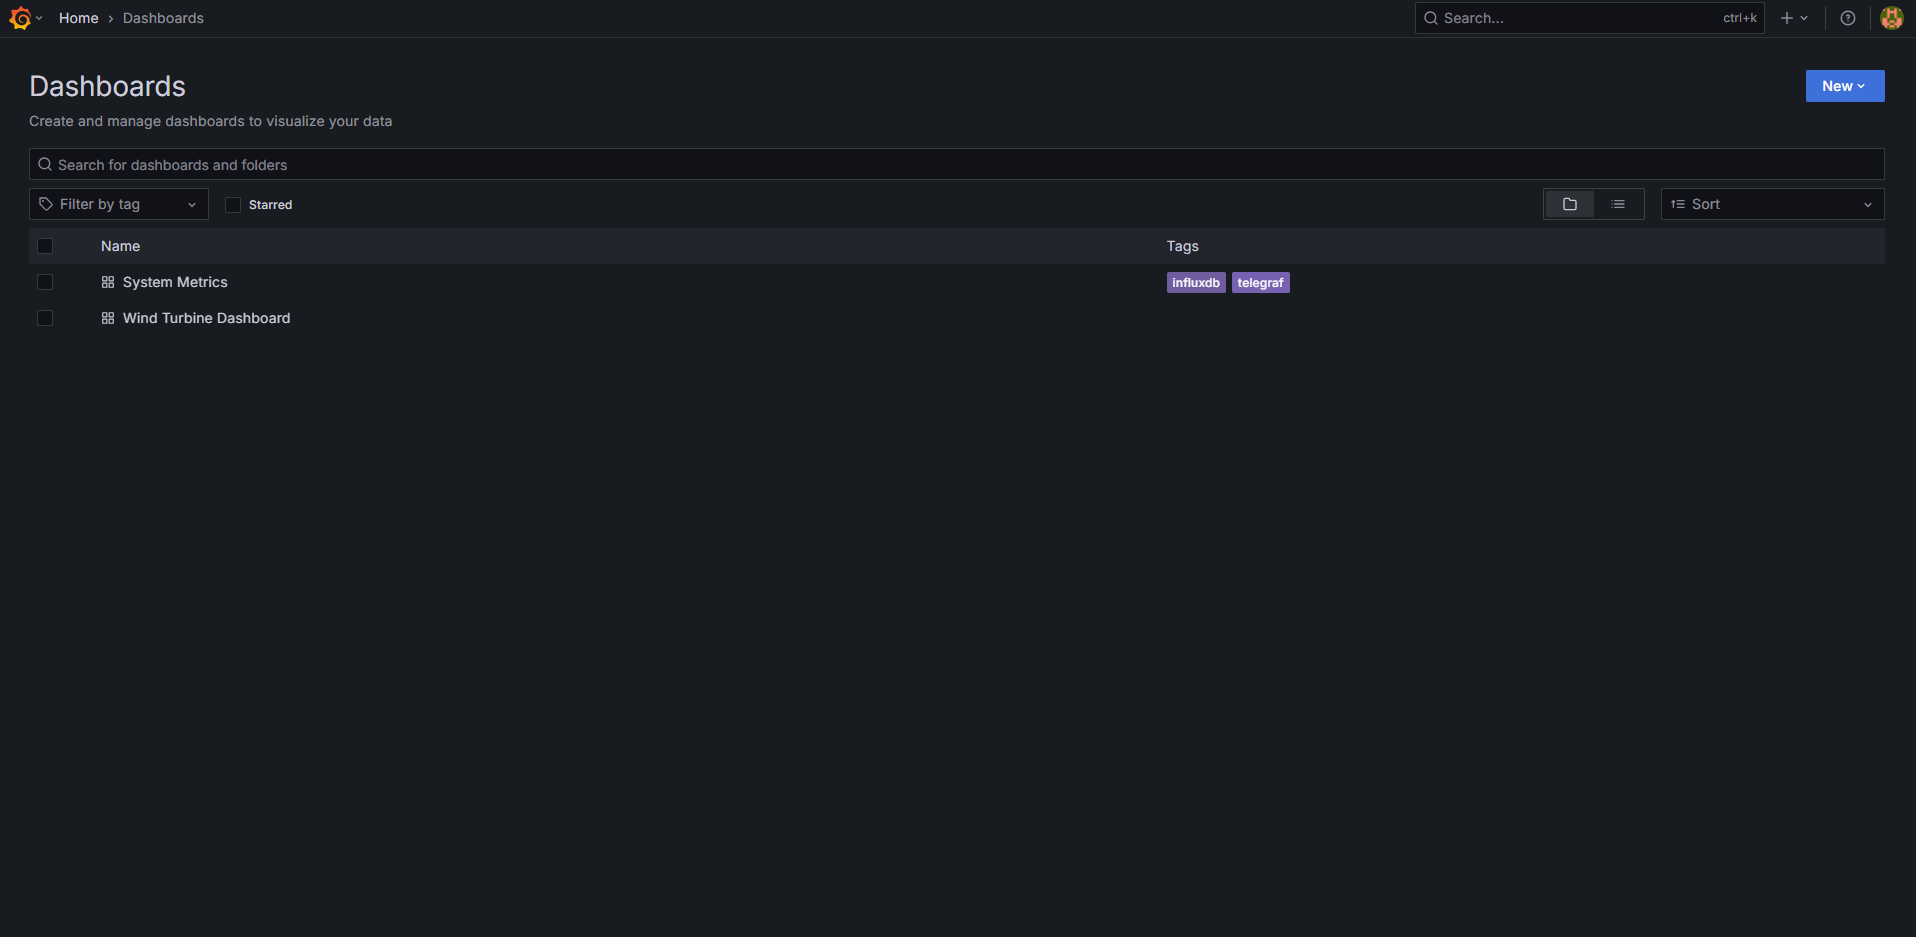
One will see the below output.