Application Flow#
This documentation provides the end-to-end flow of the application, helps you initiate the setup, and guides you in observing and validating the results.
Note
New design: Smart Classroom is now a desktop app. The UI has been redesigned since the previous release:
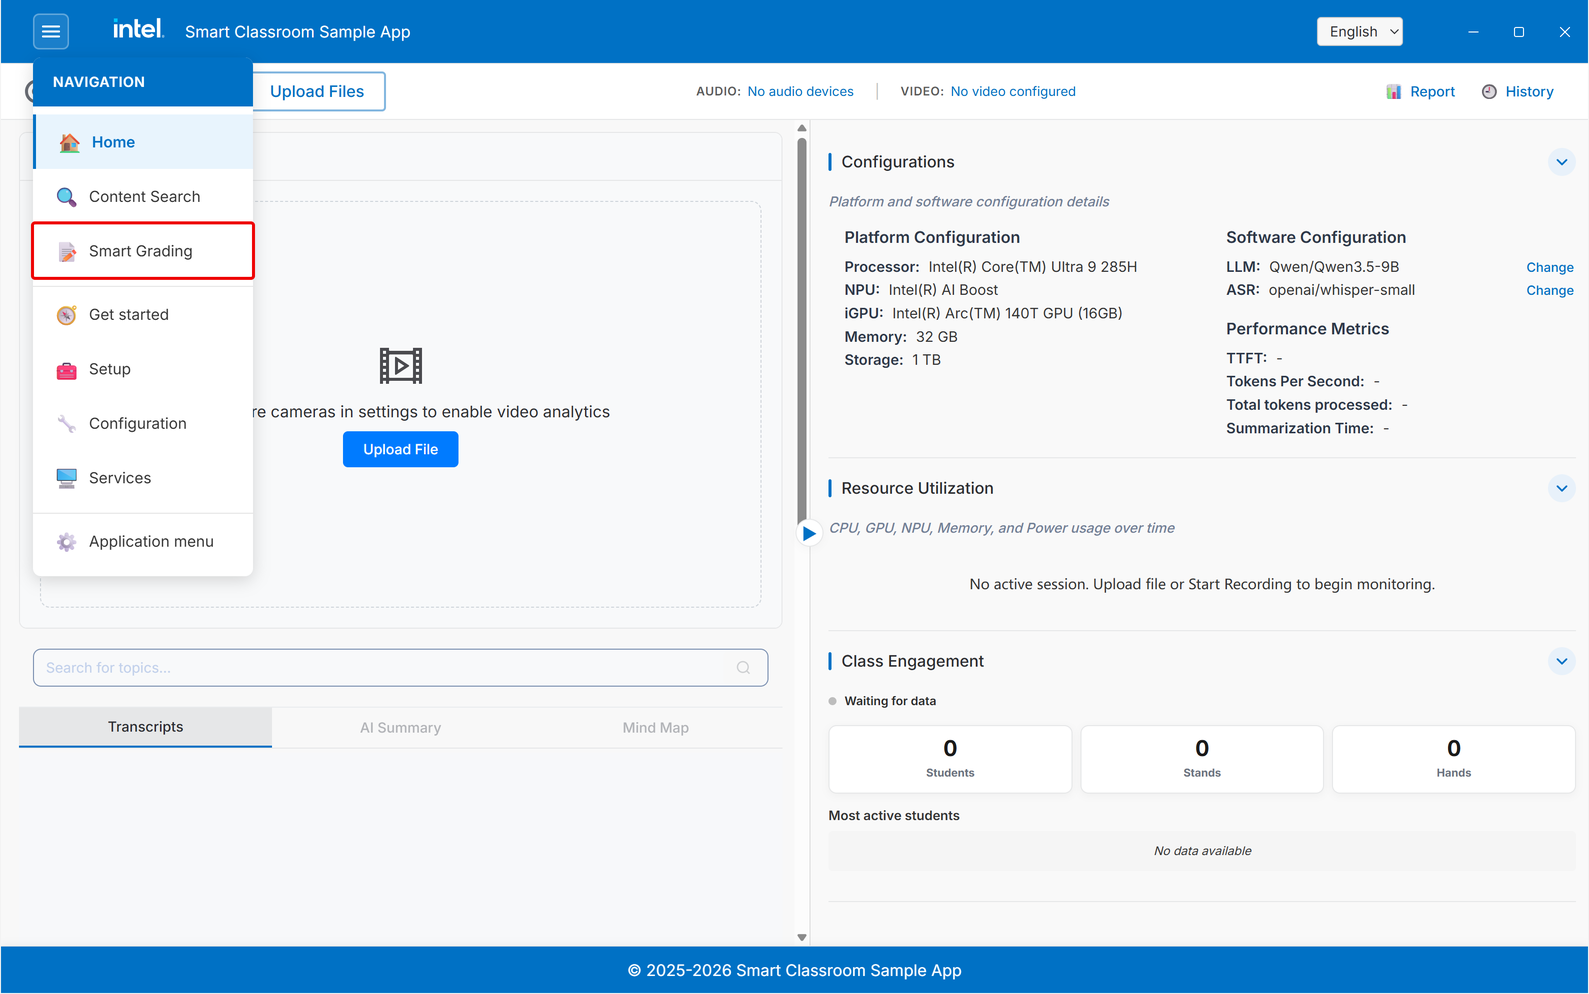
The ☰ menu at the top left is the main navigation. It opens Home, Content Search, and Smart Grading, plus the Get started, Setup, Configuration, and Services tools.
Report and History buttons sit at the right of the toolbar on the Home screen.
The right panel has new Performance Metrics, Resource Utilization, and Class Engagement views.
Screenshots in this guide show the current desktop app.
You can start the application by using Upload Files or by clicking Start Recording. This documentation guides you through the upload files option.
Step 1: Upload Files#
Click Upload Files in the toolbar, or Upload File in the video area, to open the upload dialog. Choose a file for each input you have: Audio File, Front Camera File, Back Camera File, and Board Camera File. Each input opens a file picker.
Accepted file formats:
Audio: .mp3 or .wav or .m4a
Video: .mp4
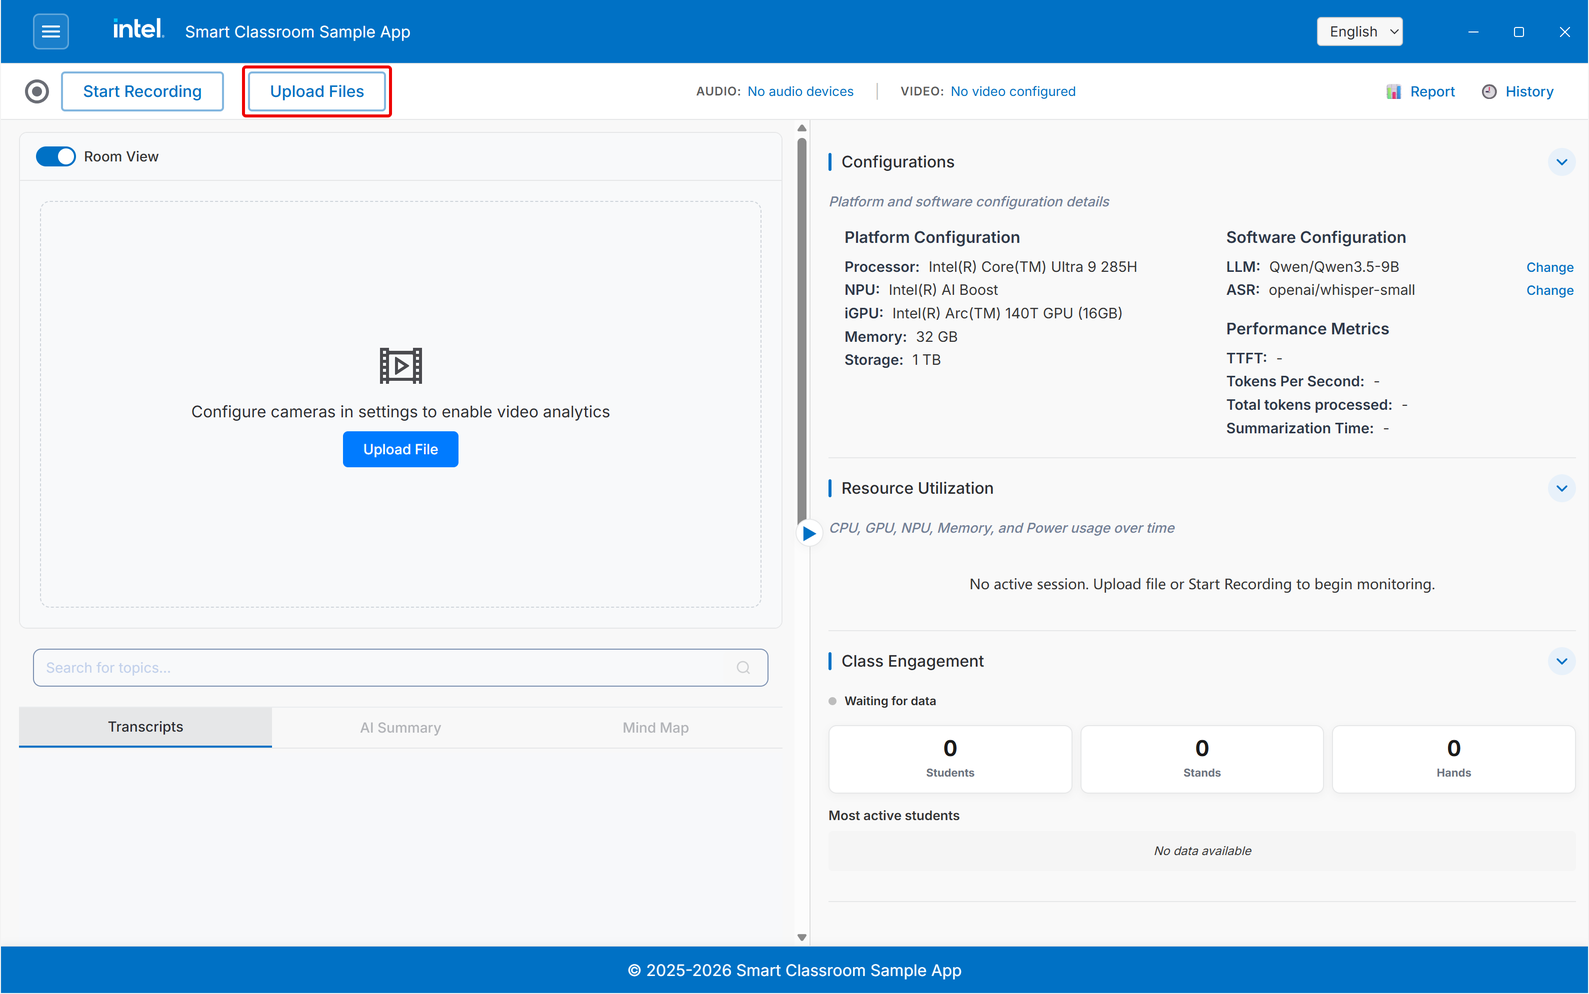
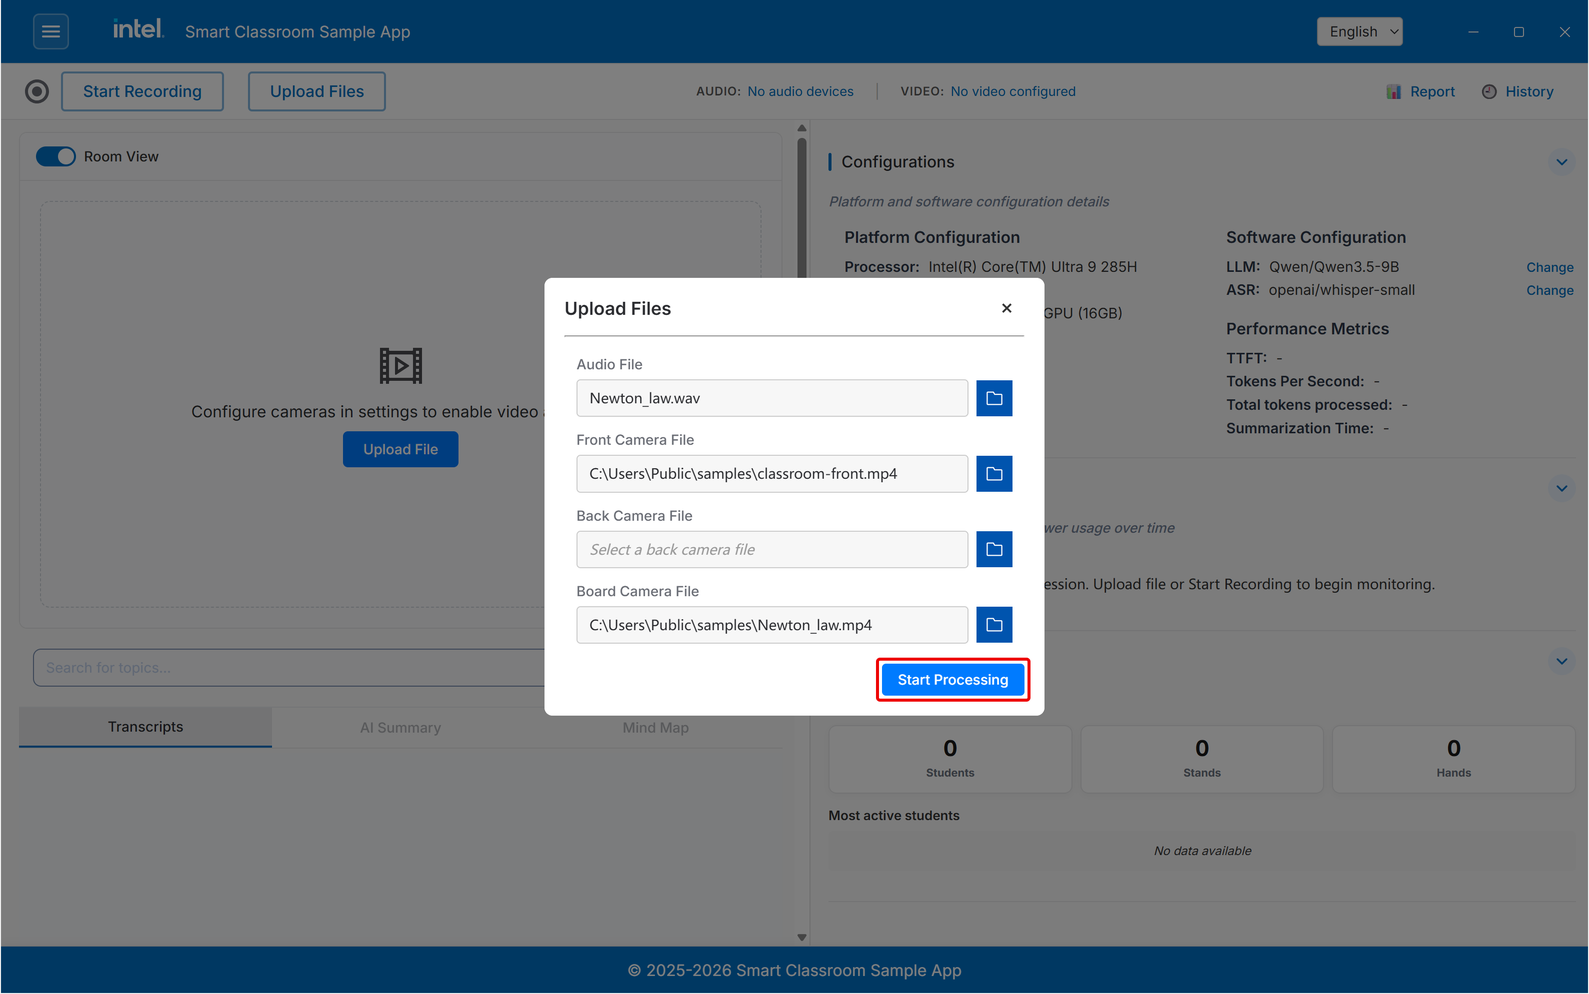
After selecting the files, click Start Processing.
Note
Search is enabled only after content segmentation.
Step 2: Audio Analysis and Video Streaming#
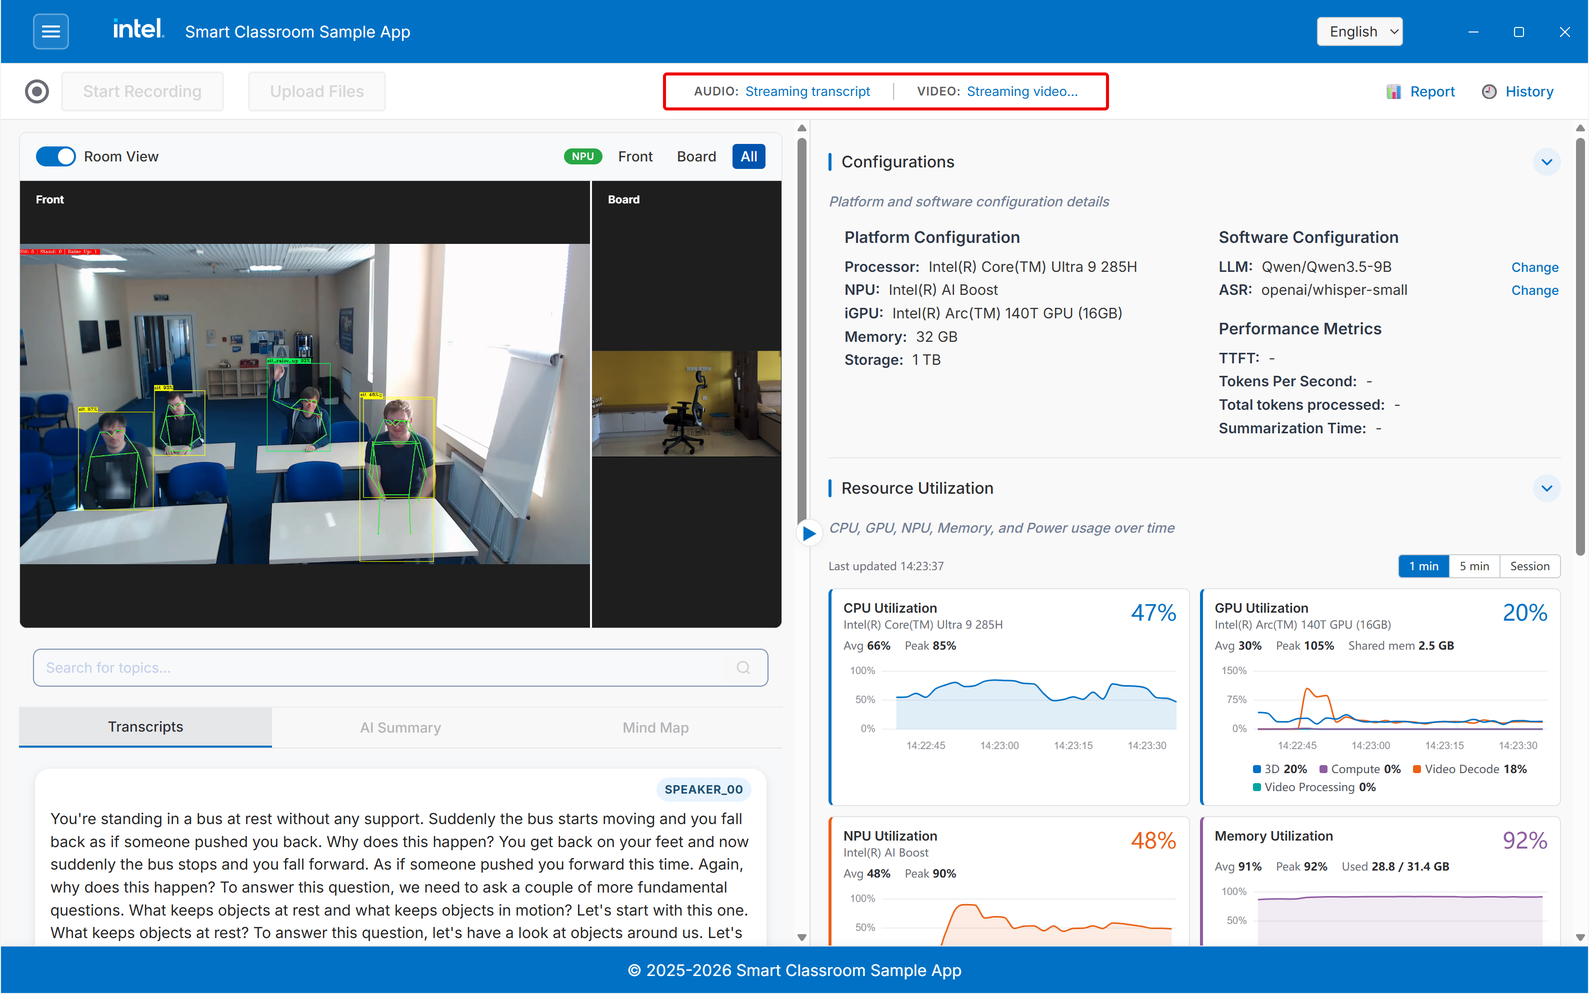
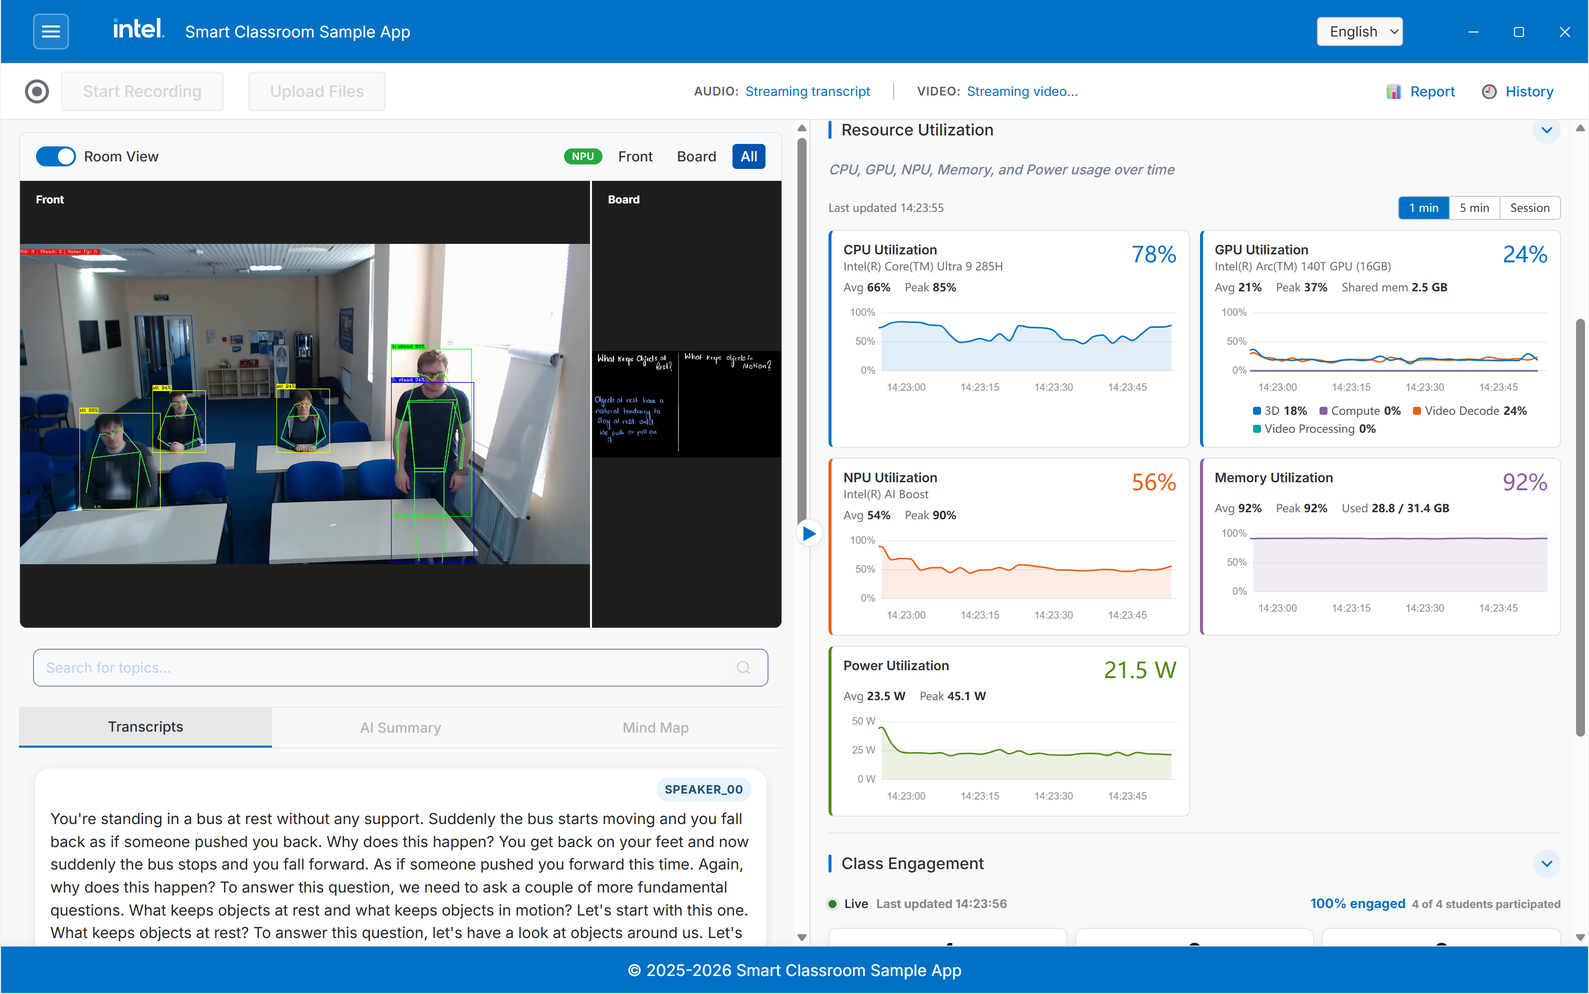
The application starts transcription after analyzing the audio, and the videos are streamed in parallel as shown below.
Right Panel#
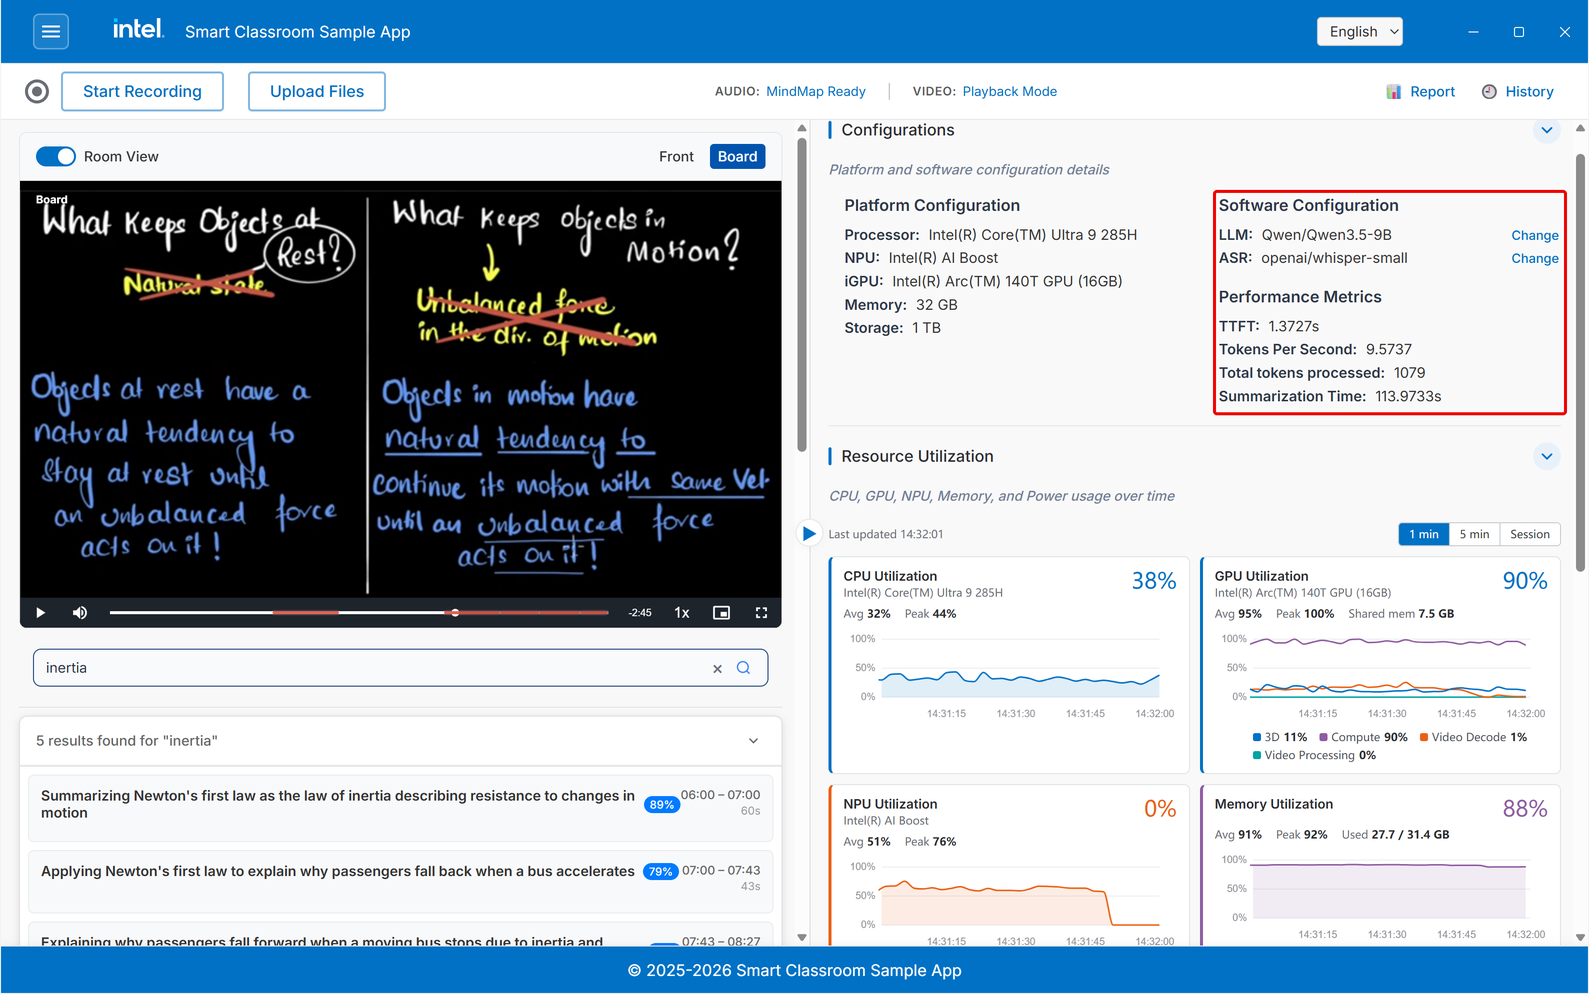
Configurations - The platform (processor, NPU, iGPU, memory, storage) and the models in use. Click Change next to LLM or ASR to switch models.
Performance Metrics - Measured for the current session’s summarization:
TTFT - Time to first token.
Tokens Per Second - Generation throughput.
Total tokens processed - Tokens processed by the LLM for the session.
Summarization Time - Time taken to produce the summary.
Resource Utilization - Live CPU, GPU, NPU, Memory, and Power cards. Each card shows the current value with Avg and Peak, over the last 1 min, 5 min, or the whole Session. The GPU card breaks utilization down into 3D, Compute, Video Decode, and Video Processing, and shows shared GPU memory.
Class Engagement - Live counts of students, stand-ups, and raised hands, the most active students, and the speaking timeline.
Step 3: Tabs Switch#
The user can switch between tabs as shown below:
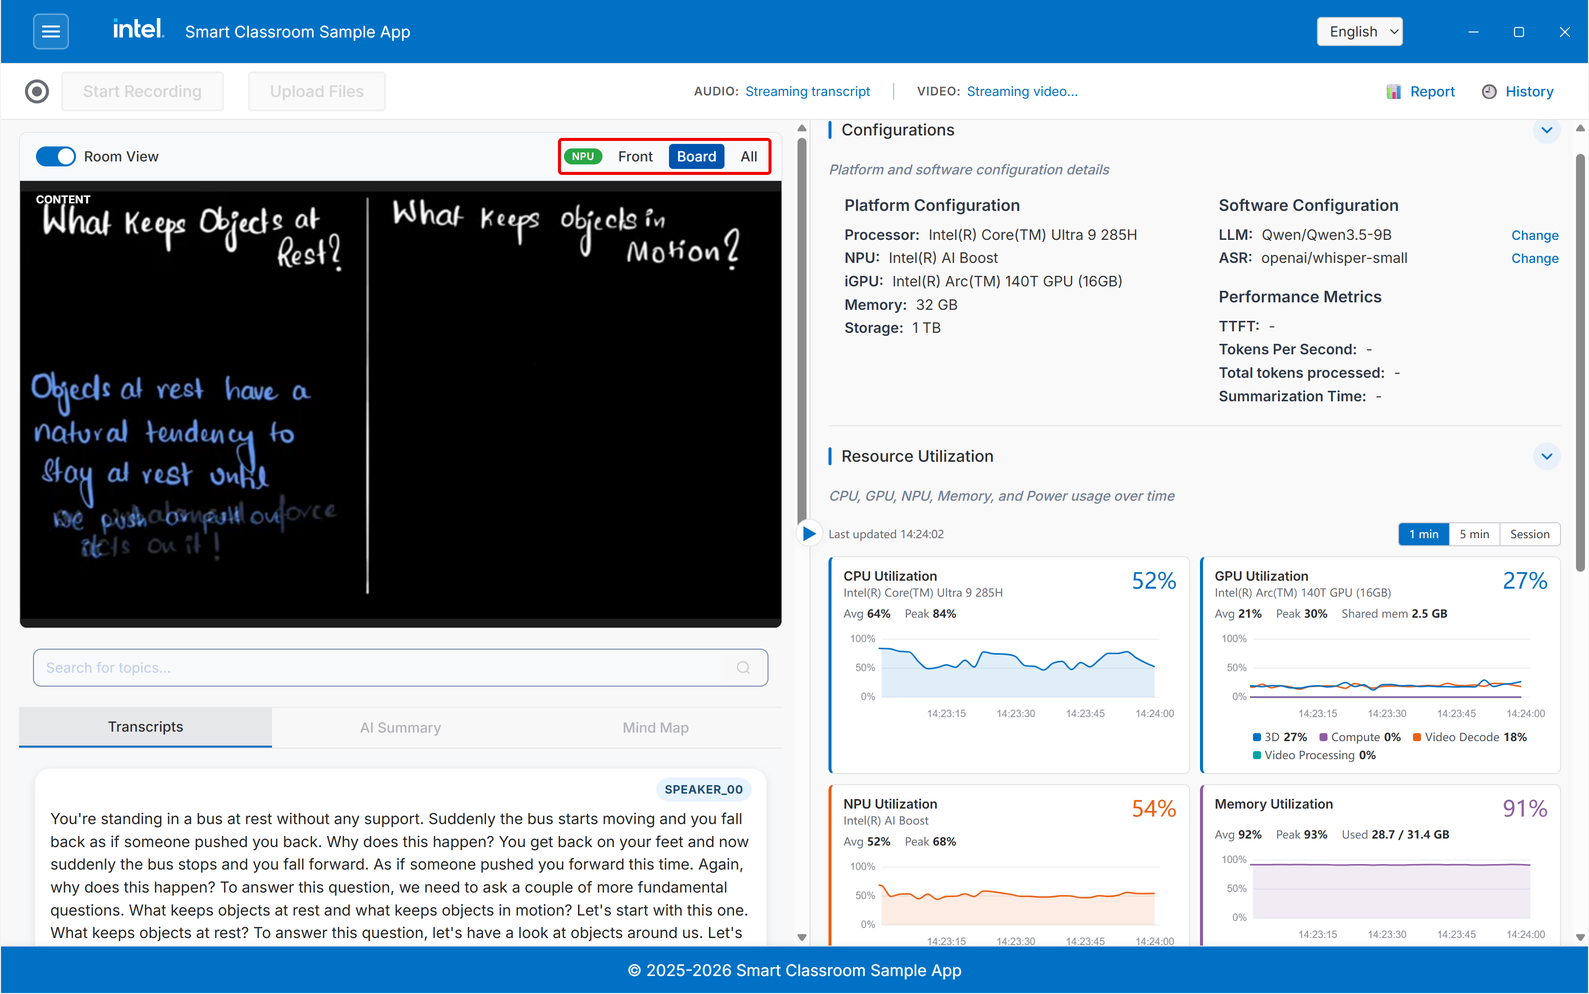
The Room View toggle switches between full audio–video mode and audio-only mode. When disabled, the video component is hidden and only the audio panel remains visible.
Step 4: Transcription and Speaker Timeline#
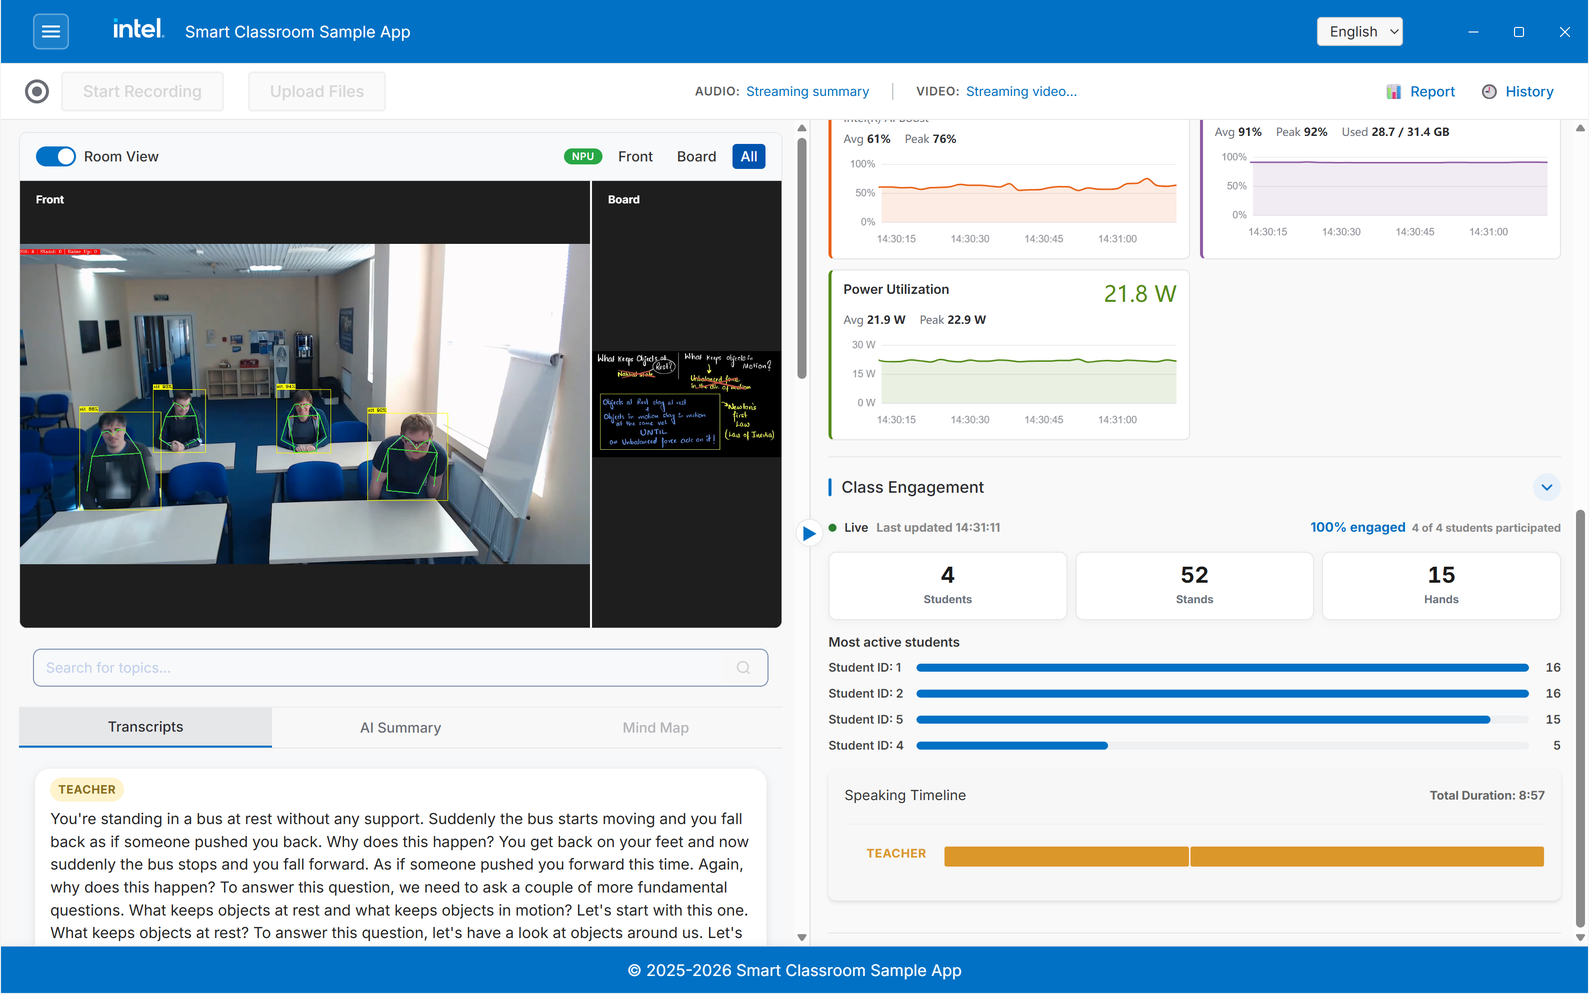
Once the teacher is identified, labels are updated accordingly:
Step 5: Content-Segmentation#
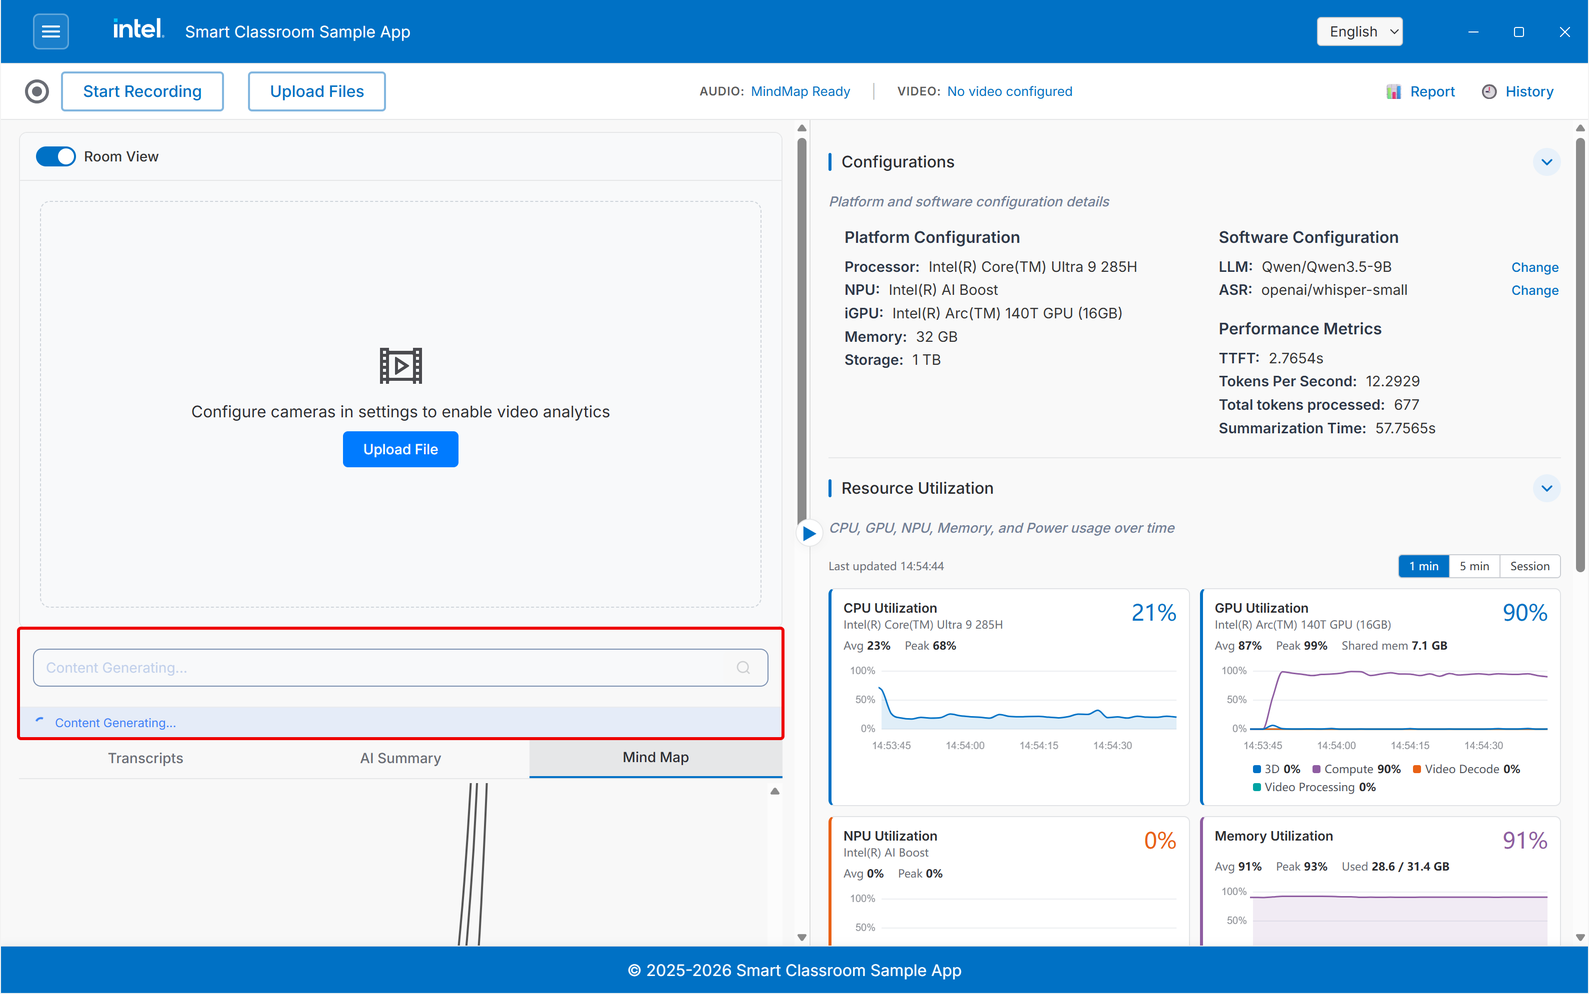
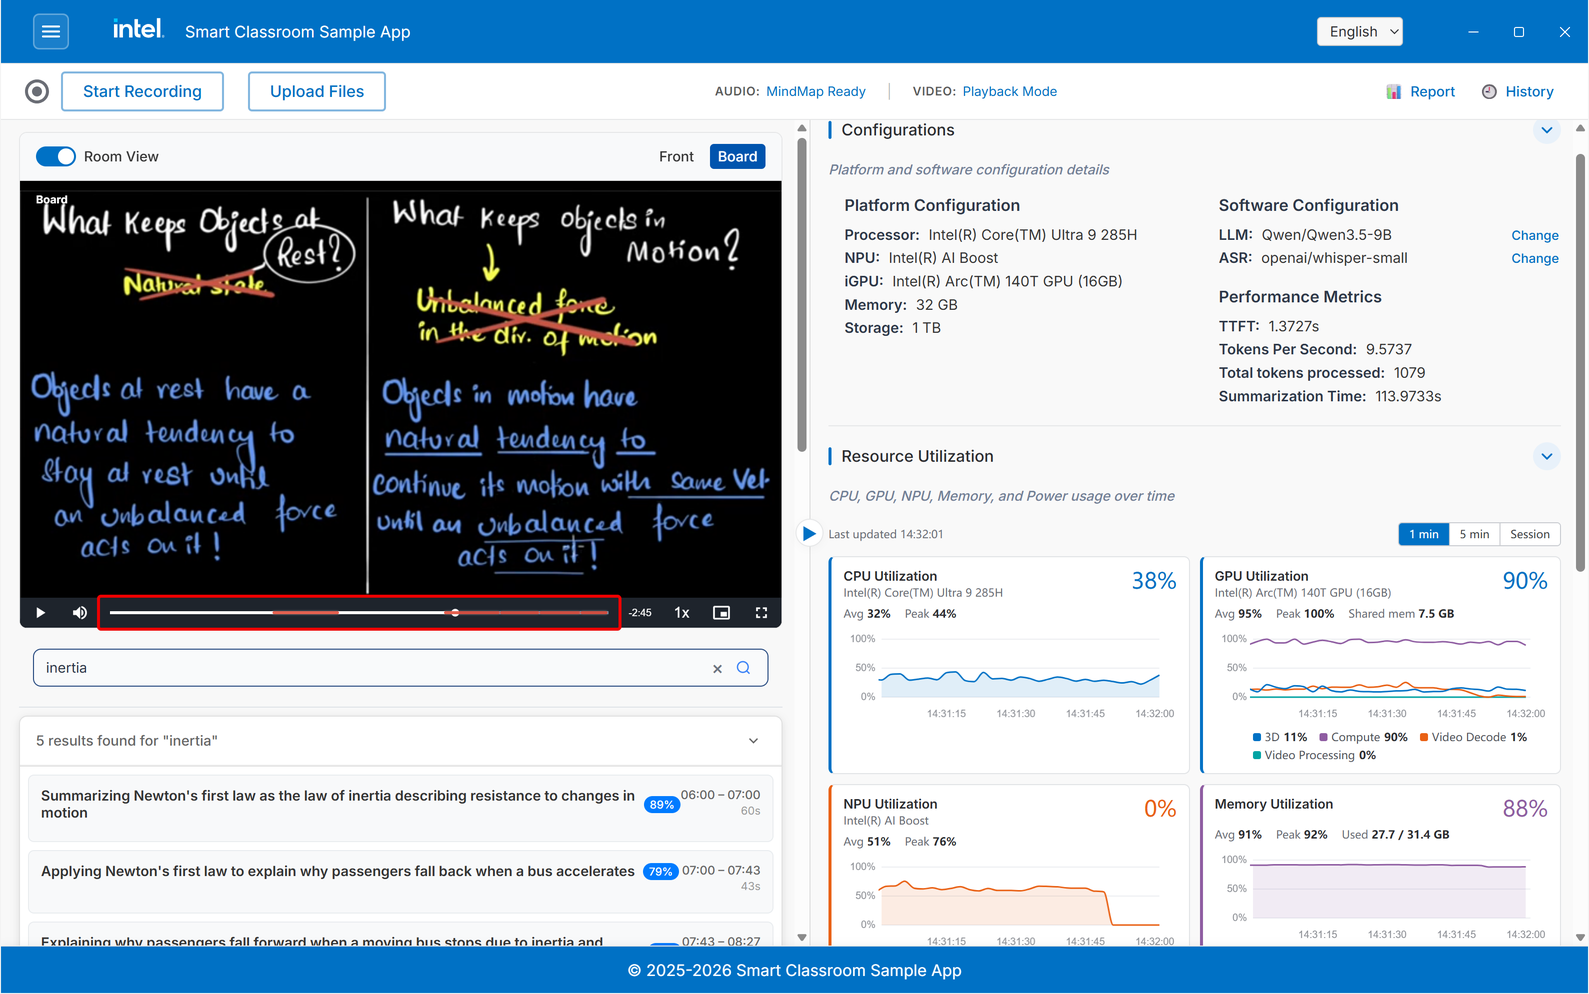
After the MindMap is generated and video processing is completed, content segmentation starts and video playback is enabled for video search.
Audio+Video: content segmentation is enabled after the MindMap is generated and video processing is completed.
Step 6: Final State#
Audio: After transcription and post summary, MindMap gets generated
Video: After video processing, playbackMode is enabled and, based on the topic search, the results are shown
VideoSearch: Based on the search results, the video timeline is highlighted at the respective timestamps of the topic
Step 7: Class Report#
Once processing settles, a structured Class Report is generated from the session. It combines the measured data collected during processing (attendance, speaking speed, hand-raise counts, keywords, mind map, and so on) with an AI-generated teaching assessment, and can be downloaded as a Word or PDF document.
Open it with the Report button at the right of the toolbar.
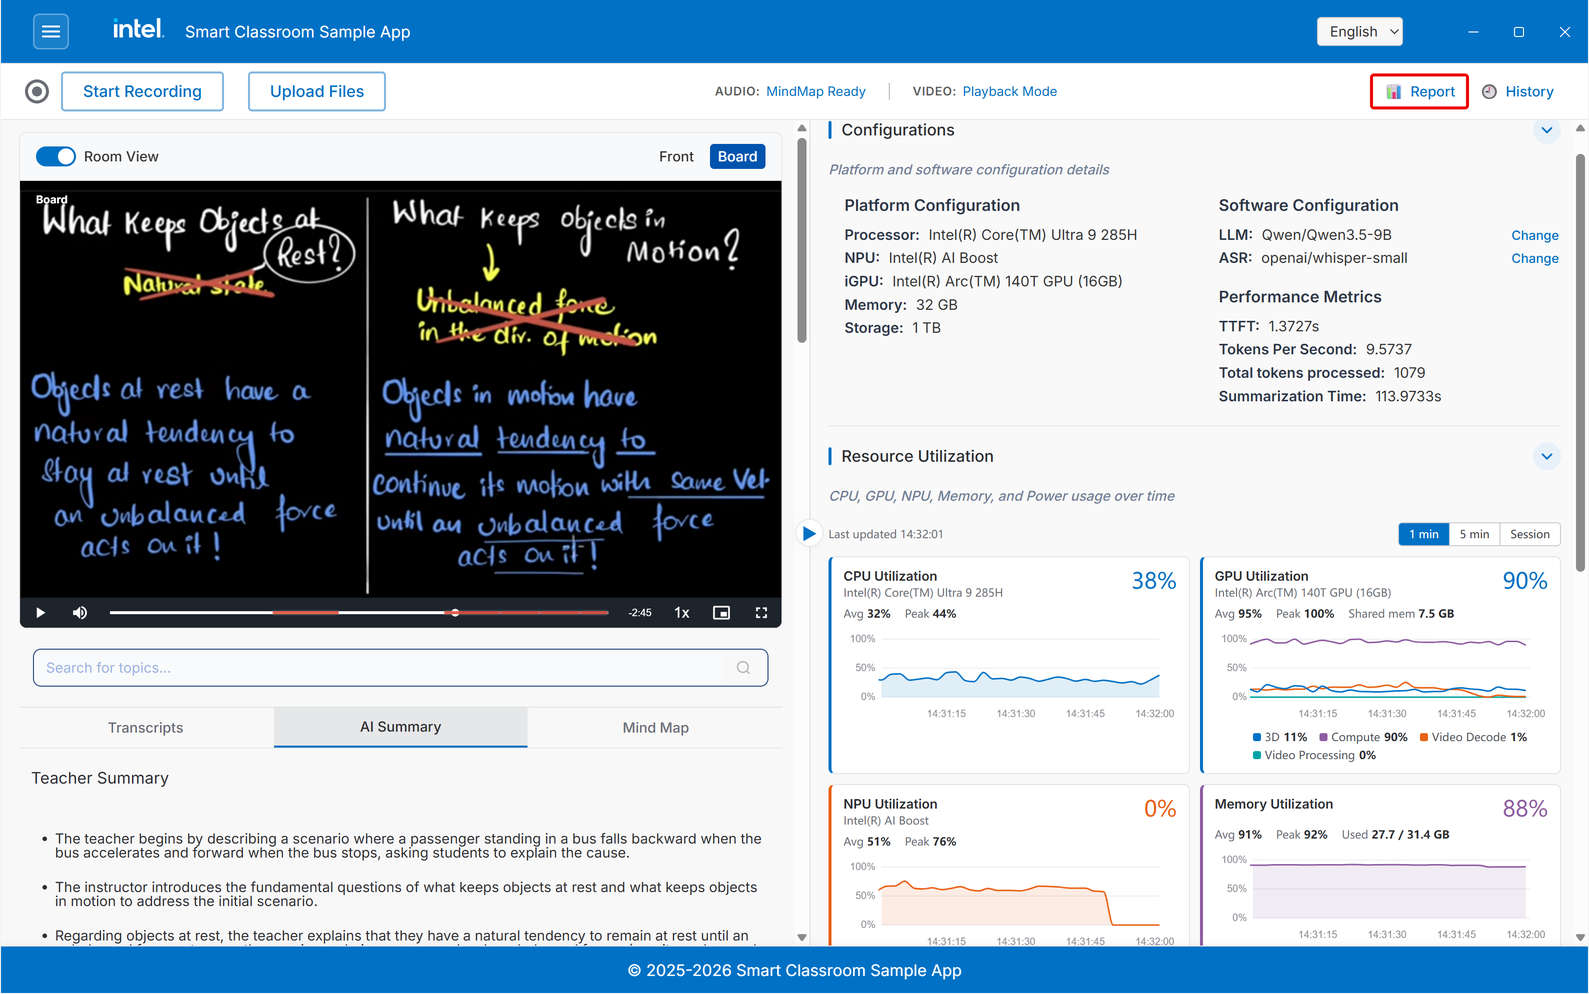
For details, see the Class Report Flow.
Step 8: Session History#
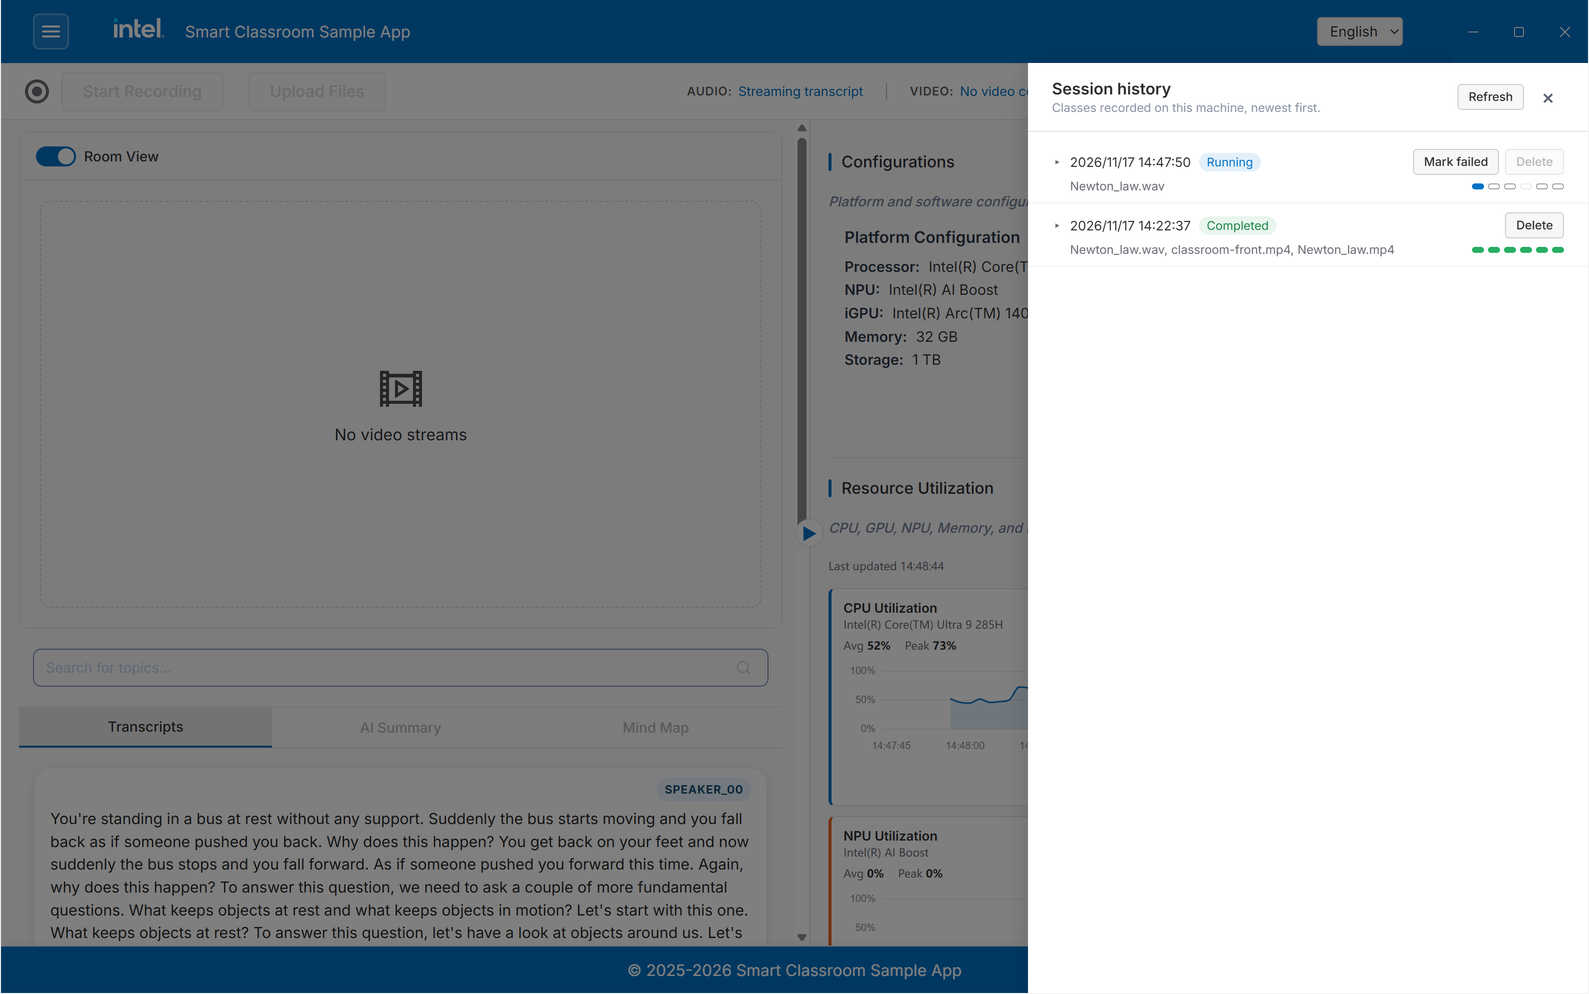
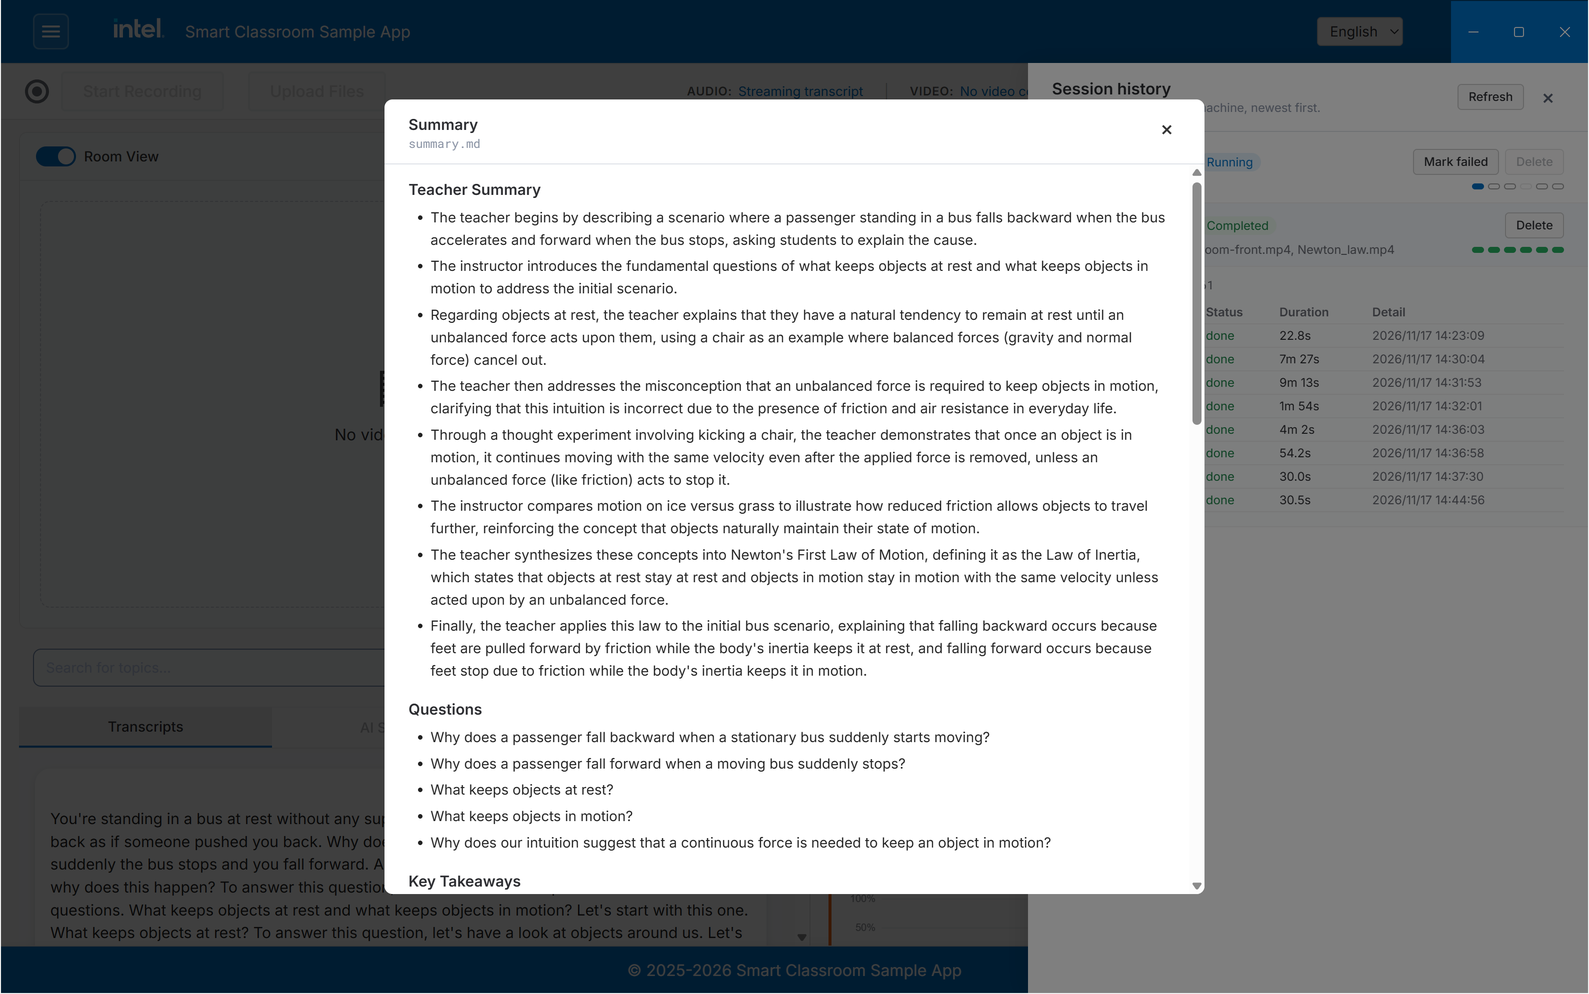
History is new in this release. Every recording and upload is saved as a session on this machine, and processing stages that run after the class (summary, mind map, topic segmentation, report) continue in the background. Click History at the right of the toolbar to open the Session history panel, which lists the sessions newest first.
Each row shows when the session started, its state (Running, Completed, Failed, or Cancelled), its source files, and a colored marker for each stage.
Mark failed - Shown for a running session. Use it for a session that is stuck.
Delete - Removes the session and every file it produced. It is disabled while the session is running.
Click a row to expand it. The stage table lists each stage with its status, duration, and details.
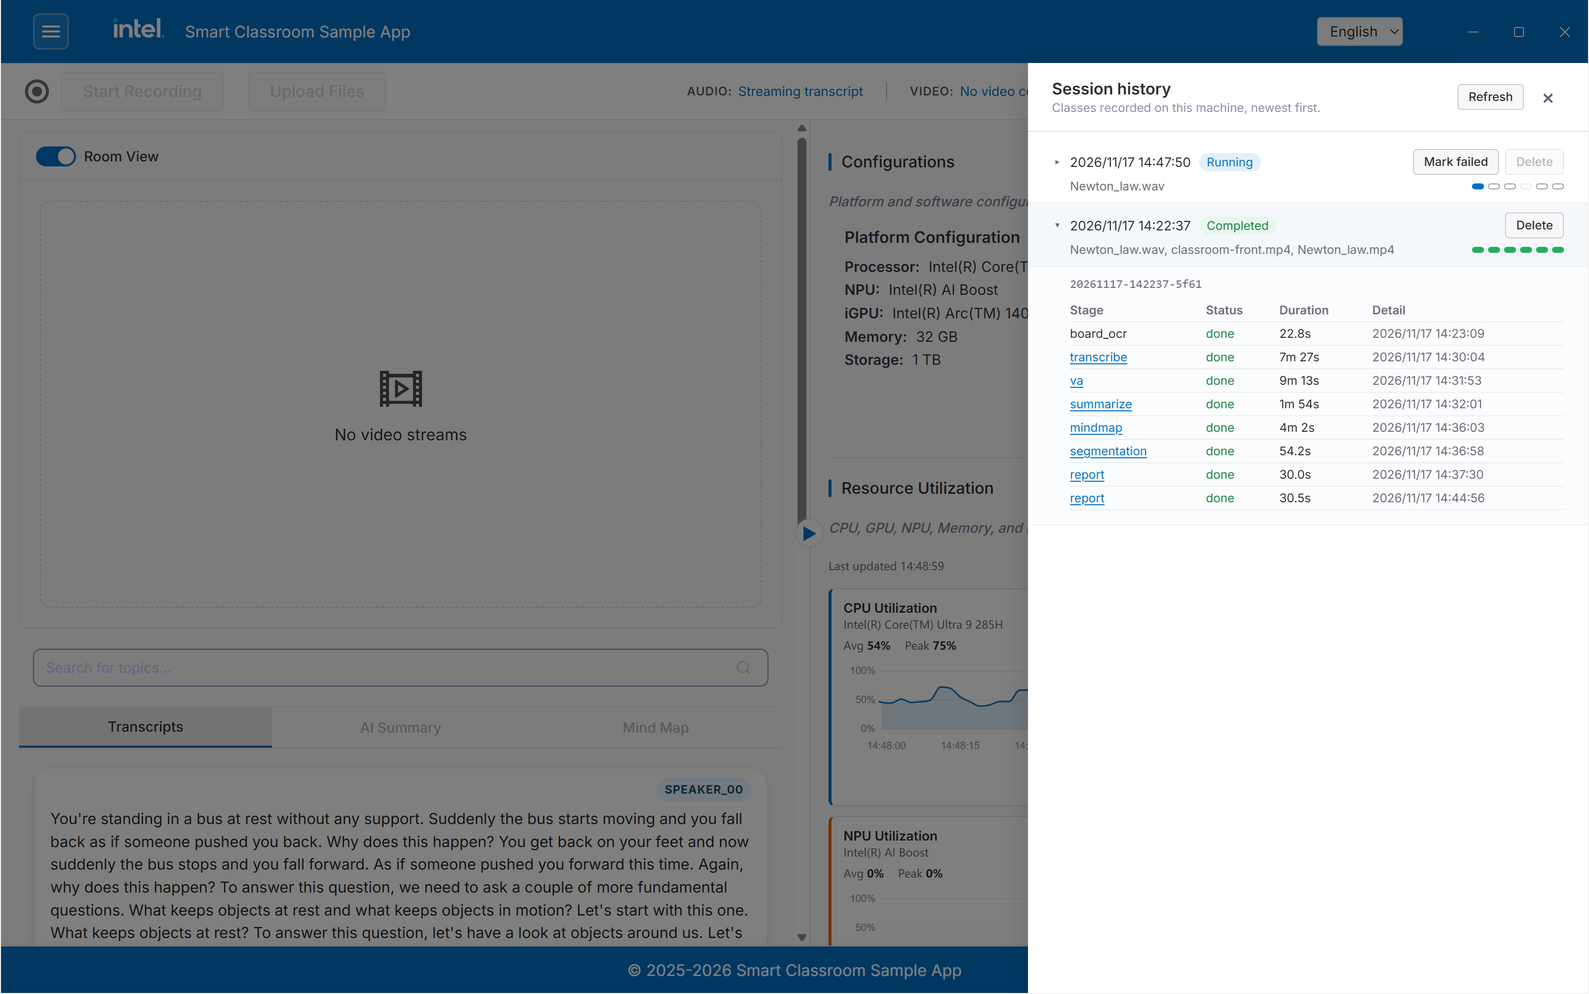
A stage that wrote an output file appears as a link. Click it to open the file, such as the transcript, summary, mind map, or report, in a viewer.
Step 9: Grading#
Scanned exam papers can be scored automatically. You provide a folder of papers (PDF) and a rubric, and the system renders the pages, splits them into question sections, and uses a Vision-Language Model to grade each section and produce scores with reasoning.
Open it from Smart Grading in the ☰ menu. The entry is disabled unless
features.grading.enabled is set to true in config.yaml.
For details, see the Grading Flow.
Learn More#
How It Works: Technical architecture and design details.
Content Search Flow: The flow of the content search functionality.
Class Report Flow: The flow of generating and exporting a class report.
Grading Flow: The flow of grading scanned exam papers.