Get Started#
Time to Complete: 30 minutes
Programming Language: Python 3
Configure Docker#
To configure Docker:
Run Docker as Non-Root: Follow the steps in Manage Docker as a non-root user.
Configure Proxy (if required):
Set up proxy settings for Docker client and containers as described in Docker Proxy Configuration.
Example
~/.docker/config.json:{ "proxies": { "default": { "httpProxy": "http://<proxy_server>:<proxy_port>", "httpsProxy": "http://<proxy_server>:<proxy_port>", "noProxy": "127.0.0.1,localhost" } } }
Configure the Docker daemon proxy as per Systemd Unit File.
Enable Log Rotation:
Add the following configuration to
/etc/docker/daemon.json:{ "log-driver": "json-file", "log-opts": { "max-size": "10m", "max-file": "5" } }
Reload and restart Docker:
sudo systemctl daemon-reload
sudo systemctl restart docker
Clone source code#
git clone https://github.com/open-edge-platform/edge-ai-suites.git
cd edge-ai-suites/manufacturing-ai-suite/wind-turbine-anomaly-detection
Data flow explanation#
The data flow remains same as that explained in the High-Level Architecture. Let’s specifically talk about the wind turbine anomaly detection use case here by ingesting the data using the OPC-UA simulator and publishing the anomaly alerts to MQTT broker.
Data Sources#
Using the edge-ai-suites/manufacturing-ai-suite/wind-turbine-anomaly-detection/simulator/simulation_data/windturbine_data.csv which is a normalized version of open source data wind turbine dataset (edge-ai-suites/manufacturing-ai-suite/wind-turbine-anomaly-detection/training/T1.csv) from https://www.kaggle.com/datasets/berkerisen/wind-turbine-scada-dataset.
This data is being ingested into Telegraf using the OPC-UA protocol using the OPC-UA data simulator.
Data Ingestion#
Telegraf through its input plugins (OPC-UA OR MQTT) gathers the data and sends this input data to both InfluxDB and Time Series Analytics Microservice.
Data Storage#
InfluxDB stores the incoming data coming from Telegraf.
Data Processing#
Time Series Analytics Microservice uses the User Defined Function(UDF) deployment package(TICK Scripts, UDFs, Models) which is already built-in to the container image. The UDF deployment package is available
at edge-ai-suites/manufacturing-ai-suite/wind-turbine-anomaly-detection/time_series_analytics_microservice. Directory details is as below:
config.json:#
The task section defines the settings for the Kapacitor task and User-Defined Functions (UDFs).
Key |
Description |
Example Value |
|---|---|---|
|
Configuration for the Model Registry microservice. |
See below for details. |
|
Configuration for the User-Defined Functions (UDFs). |
See below for details. |
Model Registry Configuration:
Key |
Description |
Example Value |
|---|---|---|
|
Boolean flag to enable fetching UDFs and models from the Model Registry microservice. |
|
|
Specifies the version of the task or model to use. |
|
UDFs Configuration:
The udfs section specifies the details of the UDFs used in the task.
Key |
Description |
Example Value |
|---|---|---|
|
The name of the UDF script. |
|
|
The name of the model file used by the UDF. |
|
Note: The maximum allowed size for
config.jsonis 5 KB.
Alerts Configuration:
The alerts section defines the settings for alerting mechanisms, such as MQTT protocol.
For OPC-UA configuration, please refer Publishing OPC-UA alerts.
Please note to enable only one of the MQTT or OPC-UA alerts.
MQTT Configuration:
The mqtt section specifies the MQTT broker details for sending alerts.
Key |
Description |
Example Value |
|---|---|---|
|
The hostname or IP address of the MQTT broker. |
|
|
The port number of the MQTT broker. |
|
|
The name of the MQTT broker configuration. |
|
config/:#
kapacitor_devmode.confwould be updated as per theconfig.jsonat runtime for usage.
udfs/:#
Contains the python script to process the incoming data. Uses Random Forest Regressor and Linear Regression machine learning algos accelerated with Intel® Extension for Scikit-learn* to run on CPU to detect the anomalous power generation data points relative to wind speed.
tick_scripts/:#
The TICKScript
windturbine_anomaly_detector.tickdetermines processing of the input data coming in. Mainly, has the details on execution of the UDF file, storage of processed data and publishing of alerts. By default, it is configured to publish the alerts to MQTT.
models/:#
The
windturbine_anomaly_detector.pklis a model built using the RandomForestRegressor Algo. More details on how it is built is accessible atedge-ai-suites/manufacturing-ai-suite/wind-turbine-anomaly-detection/training/windturbine/README.md
Deploy with Docker Compose#
Update the following fields in
.env:INFLUXDB_USERNAMEINFLUXDB_PASSWORDVISUALIZER_GRAFANA_USERVISUALIZER_GRAFANA_PASSWORDMR_PSQL_PASSWORDMR_MINIO_ACCESS_KEYMR_MINIO_SECRET_KEY
Deploy the sample app, use only one of the following options:
NOTE:
The below
make up_opcua_ingestionormake up_mqtt_ingestionfails if the above required fields are not populated as per the rules called out in.envfile.The sample app is deployed by pulling the pre-built container images of the sample app from the docker hub OR from the internal container registry (login to the docker registry from cli and configure
DOCKER_REGISTRYenv variable in.envfile atedge-ai-suites/manufacturing-ai-suite/wind-turbine-anomaly-detection)The
CONTINUOUS_SIMULATOR_INGESTIONvariable in the.envfile (for Docker Compose) and inhelm/values.yaml(for Helm deployments) is set totrueby default, enabling continuous looping of simulator data. To ingest the simulator data only once (without looping), set this variable tofalse.If
CONTINUOUS_SIMULATOR_INGESTIONis set tofalse, you may see the[inputs.opcua] status not OK for nodemessage in thetelegraflogs for OPC-UA ingestion after a single data ingestion loop. This message can be ignored.
Using OPC-UA ingestion:
make up_opcua_ingestionUsing MQTT ingestion:
make up_mqtt_ingestion
Use the following command to verify that all containers are active and error-free.
Note: The command
make statusmay show errors in containers like ia-grafana when user have not logged in for the first login OR due to session timeout. Just login again in Grafana and functionality wise if things are working, then ignoreuser token not founderrors along with other minor errors which may show up in Grafana logs.
make status
Verify the Wind Turbine Anomaly Detection Results#
Get into the InfluxDB* container:
Note: Use
kubectl exec -it <influxdb-pod-name> -n <namespace> -- /bin/bashfor the helm deployment where forreplace with namespace name where the application was deployed and for replace with InfluxDB pod name. docker exec -it ia-influxdb bash
Run following commands to see the data in InfluxDB*:
NOTE: Please ignore the error message
There was an error writing history file: open /.influx_history: read-only file systemhappening in the InfluxDB shell. This does not affect any functionality while working with the InfluxDB commands# For below command, the INFLUXDB_USERNAME and INFLUXDB_PASSWORD needs to be fetched from `.env` file # for docker compose deployment and `values.yml` for helm deployment influx -username <username> -password <passwd> use datain # database access show measurements # Run below query to check and output measurement processed # by Time Series Analytics microservice select * from wind_turbine_anomaly_data
To check the output in Grafana:
Use link
http://<host_ip>:3000to launch Grafana from browser (preferably, chrome browser)Note: Use link
http://<host_ip>:30001to launch Grafana from browser (preferably, chrome browser) for the helm deploymentLogin to the Grafana with values set for
VISUALIZER_GRAFANA_USERandVISUALIZER_GRAFANA_PASSWORDin.envfile and select Wind Turbine Dashboard.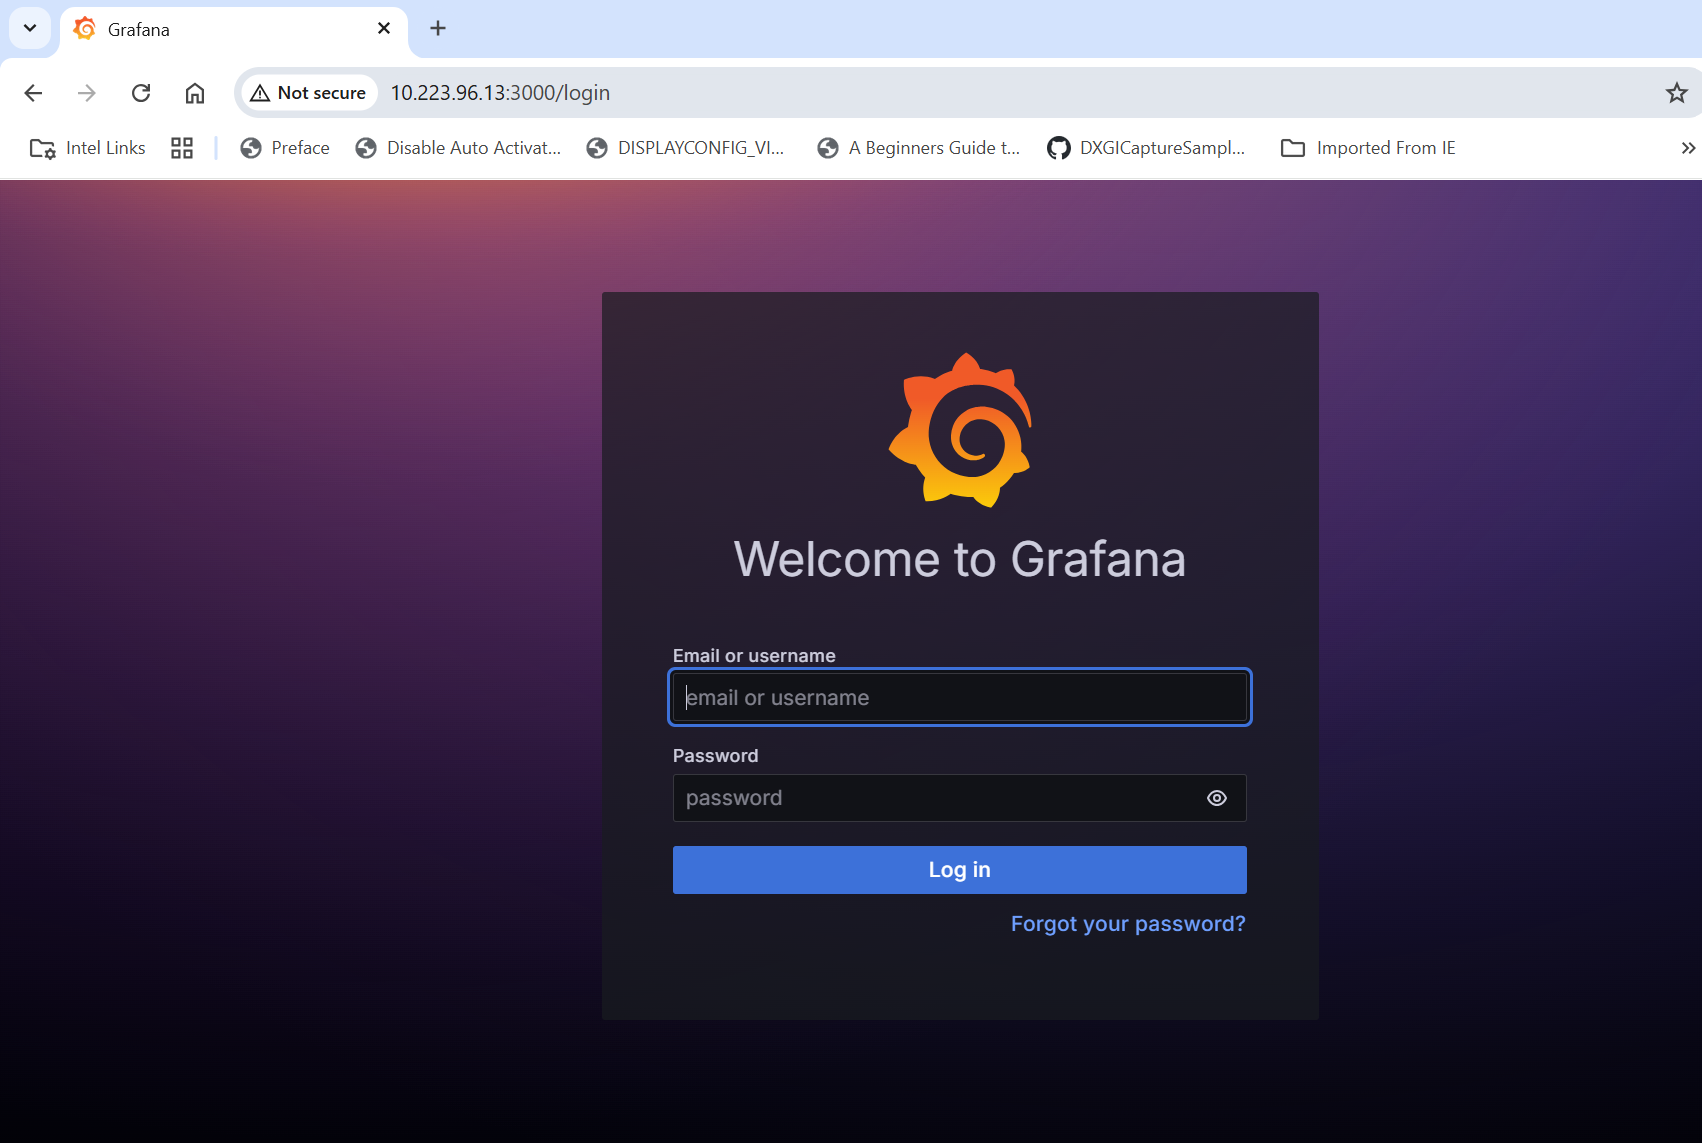
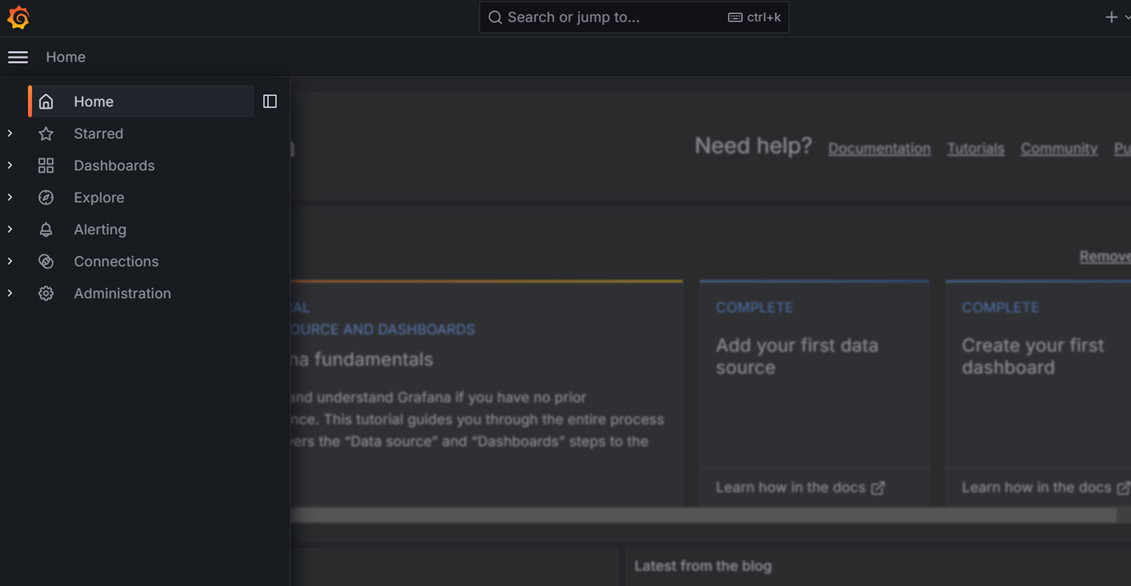
After login, click on Dashboard
Select the
Wind Turbine Dashboard.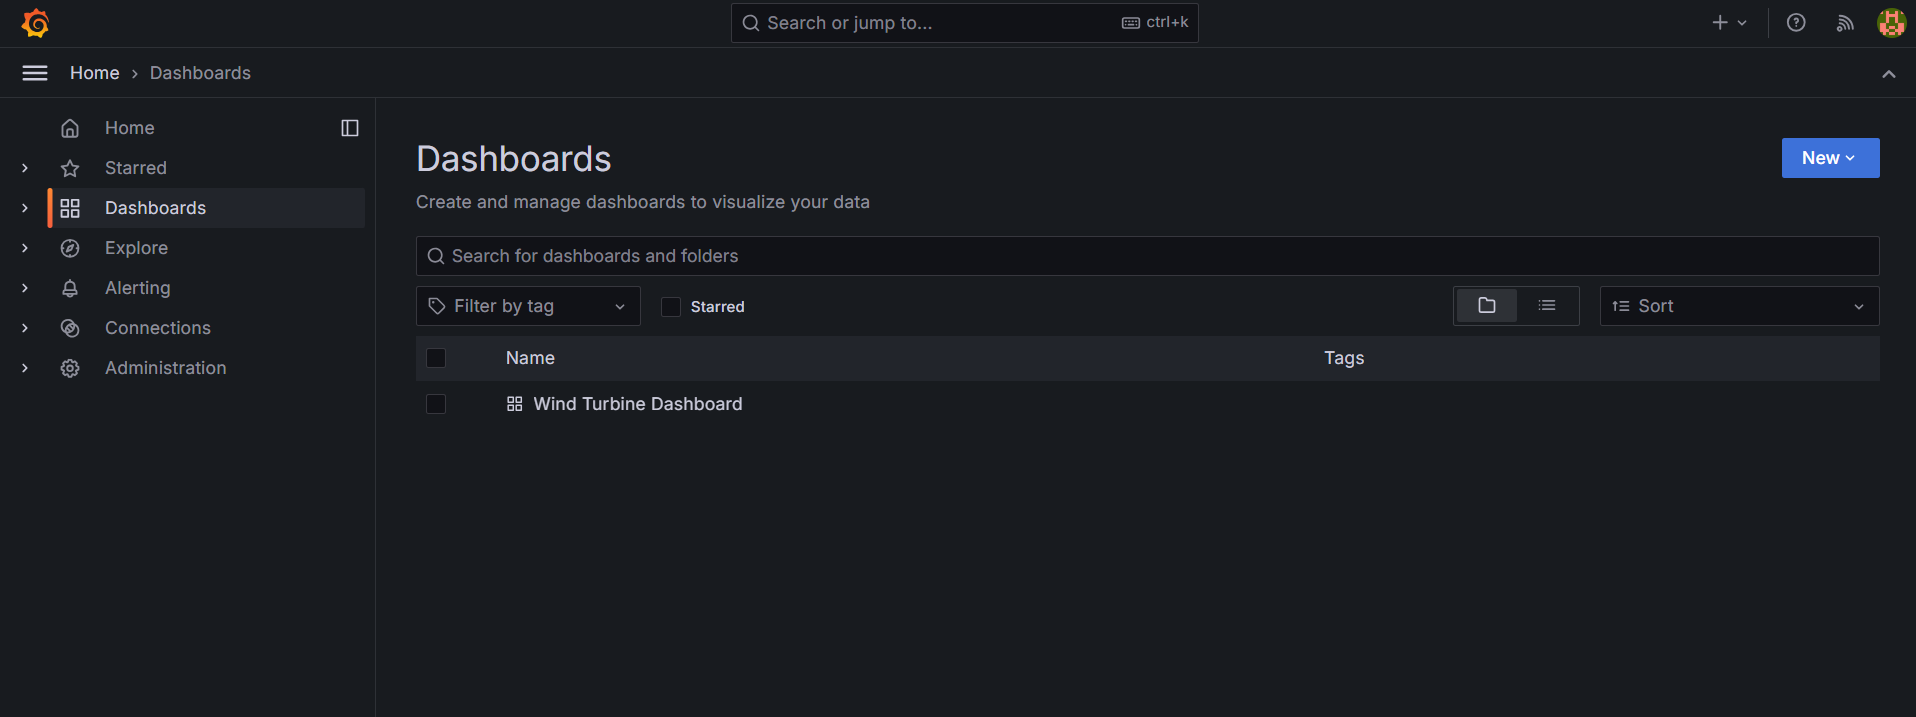
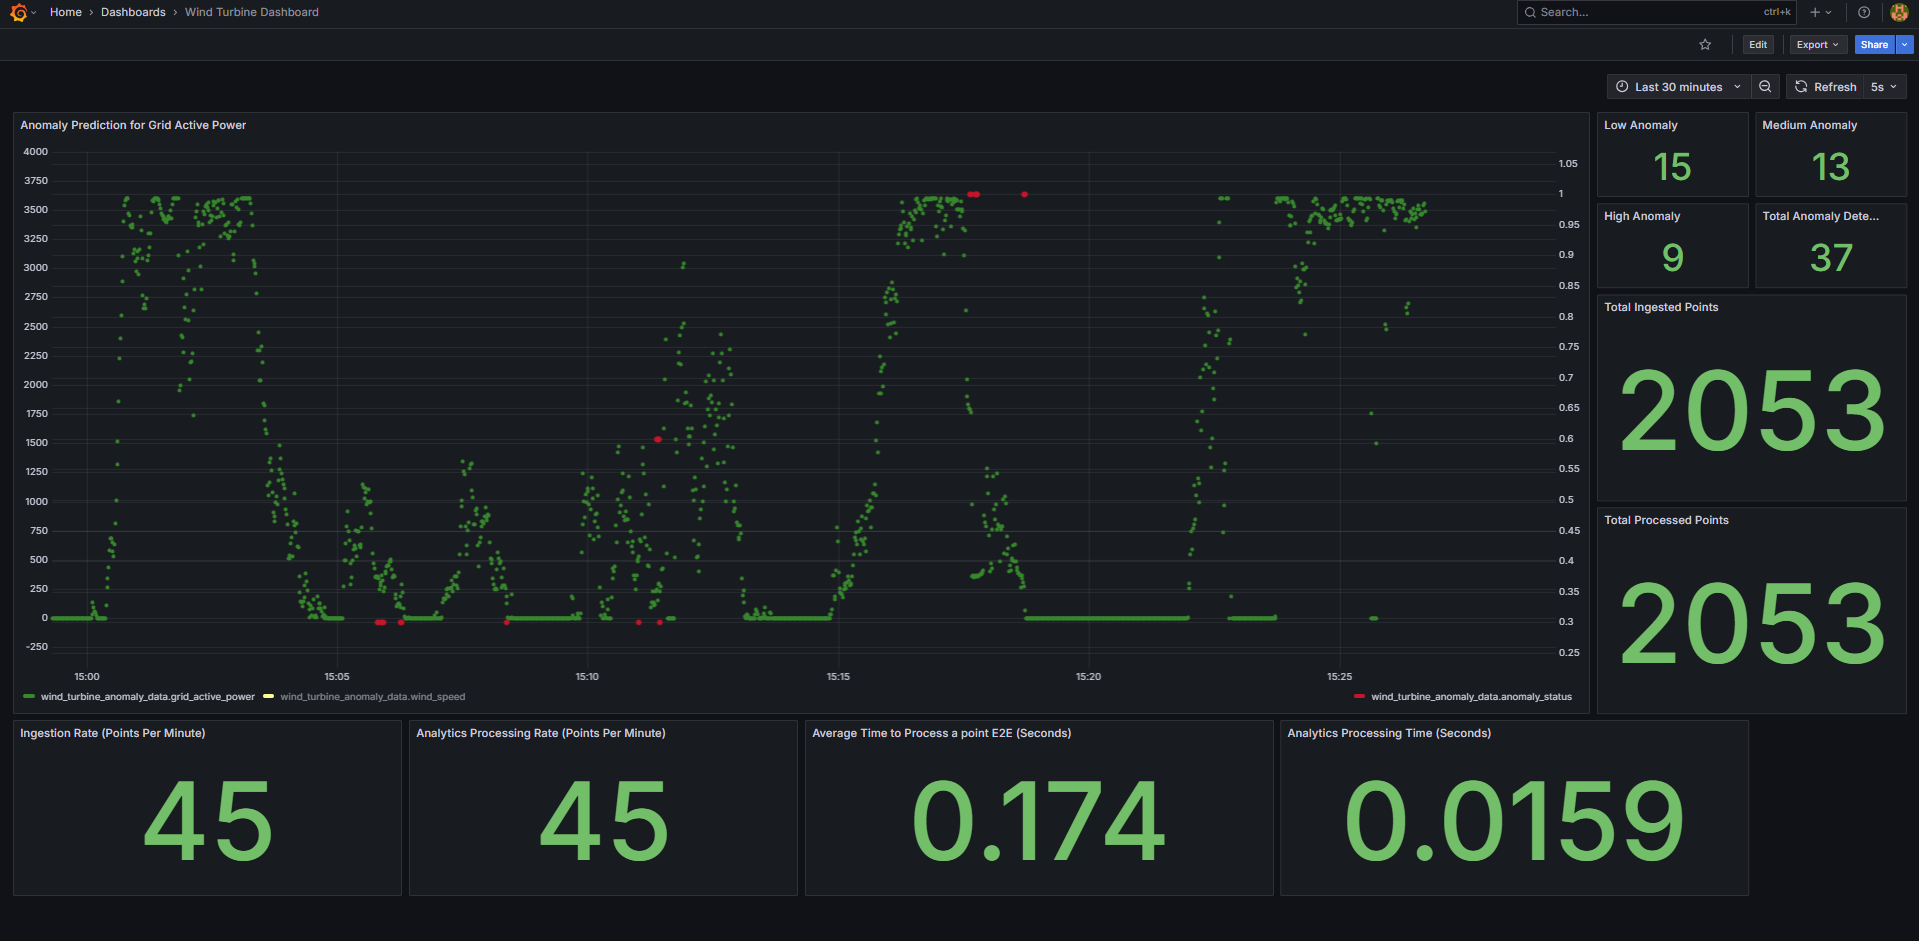
One will see the below output.
Bring down the sample app#
make down
Check logs - troubleshooting#
Check container logs to catch any failures:
docker ps
docker logs -f <container_name>
docker logs -f <container_name> | grep -i error
Other Deployment options#
How to Deploy with Helm: Guide for deploying the sample application on a k8s cluster using Helm.
Advanced setup#
How to build from source and deploy: Guide to build from source and docker compose deployment
How to configure OPC-UA/MQTT alerts: Guide for configuring the OPC-UA/MQTT alerts in the Time Series Analytics microservice
How to configure custom UDF deployment package: Guide for deploying a customized UDF deployment package (udfs/models/tick scripts)