Enable Open Telemetry#
What telemetry data is collected#
DL Streamer Pipeline Server supports gathering metrics and logs over Open Telemetry. The supported metrics currently are:
cpu_usage_percentage: Tracks CPU usage percentage of DL Streamer Pipeline Server python processmemory_usage_bytes: Tracks memory usage in bytes of DL Streamer Pipeline Server python processfps_per_pipeline: Tracks FPS for each active pipeline instance in DL Streamer Pipeline Server
Setup using docker compose#
A ready-to-use docker compose file is provided to demonstrate Open Telemetry with DL Streamer Pipeline Server.
You can find it at: [WORKDIR]/edge-ai-libraries/microservices/dlstreamer-pipeline-server/docker/docker-compose-otel.yml
This deploys the following stack:
Open Telemetry Collector: Receives metrics and logs from DL Streamer Pipeline Server
Prometheus: Scrapes metrics from Open Telemetry Collector
Loki: Receives logs from Open Telemetry Collector
Grafana: Visualizes both metrics (via Prometheus) and logs (via Loki)
Configuration files#
Purpose |
Path |
|---|---|
OpenTelemetry |
|
Prometheus |
|
Environment settings#
All key configurations are in the .env file under [WORKDIR]/edge-ai-libraries/microservices/dlstreamer-pipeline-server/docker/.env
ENABLE_OPEN_TELEMETRY=true # true to enable open telemetry and false otherwise
OTEL_COLLECTOR_HOST=otel-collector # open telemetry container name in `[WORKDIR]/edge-ai-libraries/microservices/dlstreamer-pipeline-server/docker/docker-compose-otel.yml`. Can also be the IP address of the machine if open telemetry container is running on a different machine. Ex: OTEL_COLLECTOR_HOST=10.10.10.10
OTEL_COLLECTOR_PORT=4318 # Open telemetry container will receive data on this port. If this value is changed, ensure to update `[WORKDIR]/edge-ai-libraries/microservices/dlstreamer-pipeline-server/configs/open_telemetry/otel-collector-config.yaml` appropriately.
OTEL_EXPORT_INTERVAL_MILLIS=5000 # How often to export metrics to the open telemetry collector in milli seconds.
PROMETHEUS_PORT=9999 # The port on your host where the Prometheus UI & API will be accessible (ex: open http://<HOST_IP>:9999 to see Prometheus).
GRAFANA_PORT=3000 # The port on your host where the Grafana dashboard is exposed (ex: visit http://<HOST_IP>:3000 to visualize metrics & logs).
GRAFANA_USERNAME= # Provide username to be used to login to Grafana, ex: GRAFANA_USERNAME=dlsps123
GRAFANA_PASSWORD= # Provide username to be used to login to Grafana, ex: GRAFANA_PASSWORD=dlsps123
Running the services#
Start the entire telemetry stack
docker compose -f docker-compose-otel.yml up
Open another terminal and start a pipeline in DL Streamer Pipeline Server.
    curl http://localhost:8080/pipelines/user_defined_pipelines/pallet_defect_detection -X POST -H 'Content-Type: application/json' -d '{
    "source": {
        "uri": "file:///home/pipeline-server/resources/videos/warehouse.avi",
        "type": "uri"
    },
    "destination": {
        "metadata": {
            "type": "file",
            "path": "/tmp/results.jsonl",
            "format": "json-lines"
        },
        "frame": {
            "type": "rtsp",
            "path": "pallet-defect-detection"
        }
    },
    "parameters": {
        "detection-properties": {
            "model": "/home/pipeline-server/resources/models/geti/pallet_defect_detection/deployment/Detection/model/model.xml",
            "device": "CPU"
        }
    }
}'
This returns a pipeline_id like:
658a5260f37d11ef94fc0242ac160005
Visualizing metrics in Prometheus#
Visit http://<HOST_IP>:<PROMETHEUS_PORT>
You can run queries like:
cpu_usage_percentagememory_usage_bytesfps_per_pipeline{}If you are starting multiple pipelines, then it can also be queried per pipeline ID. Example:
fps_per_pipeline{pipeline_id="658a5260f37d11ef94fc0242ac160005"}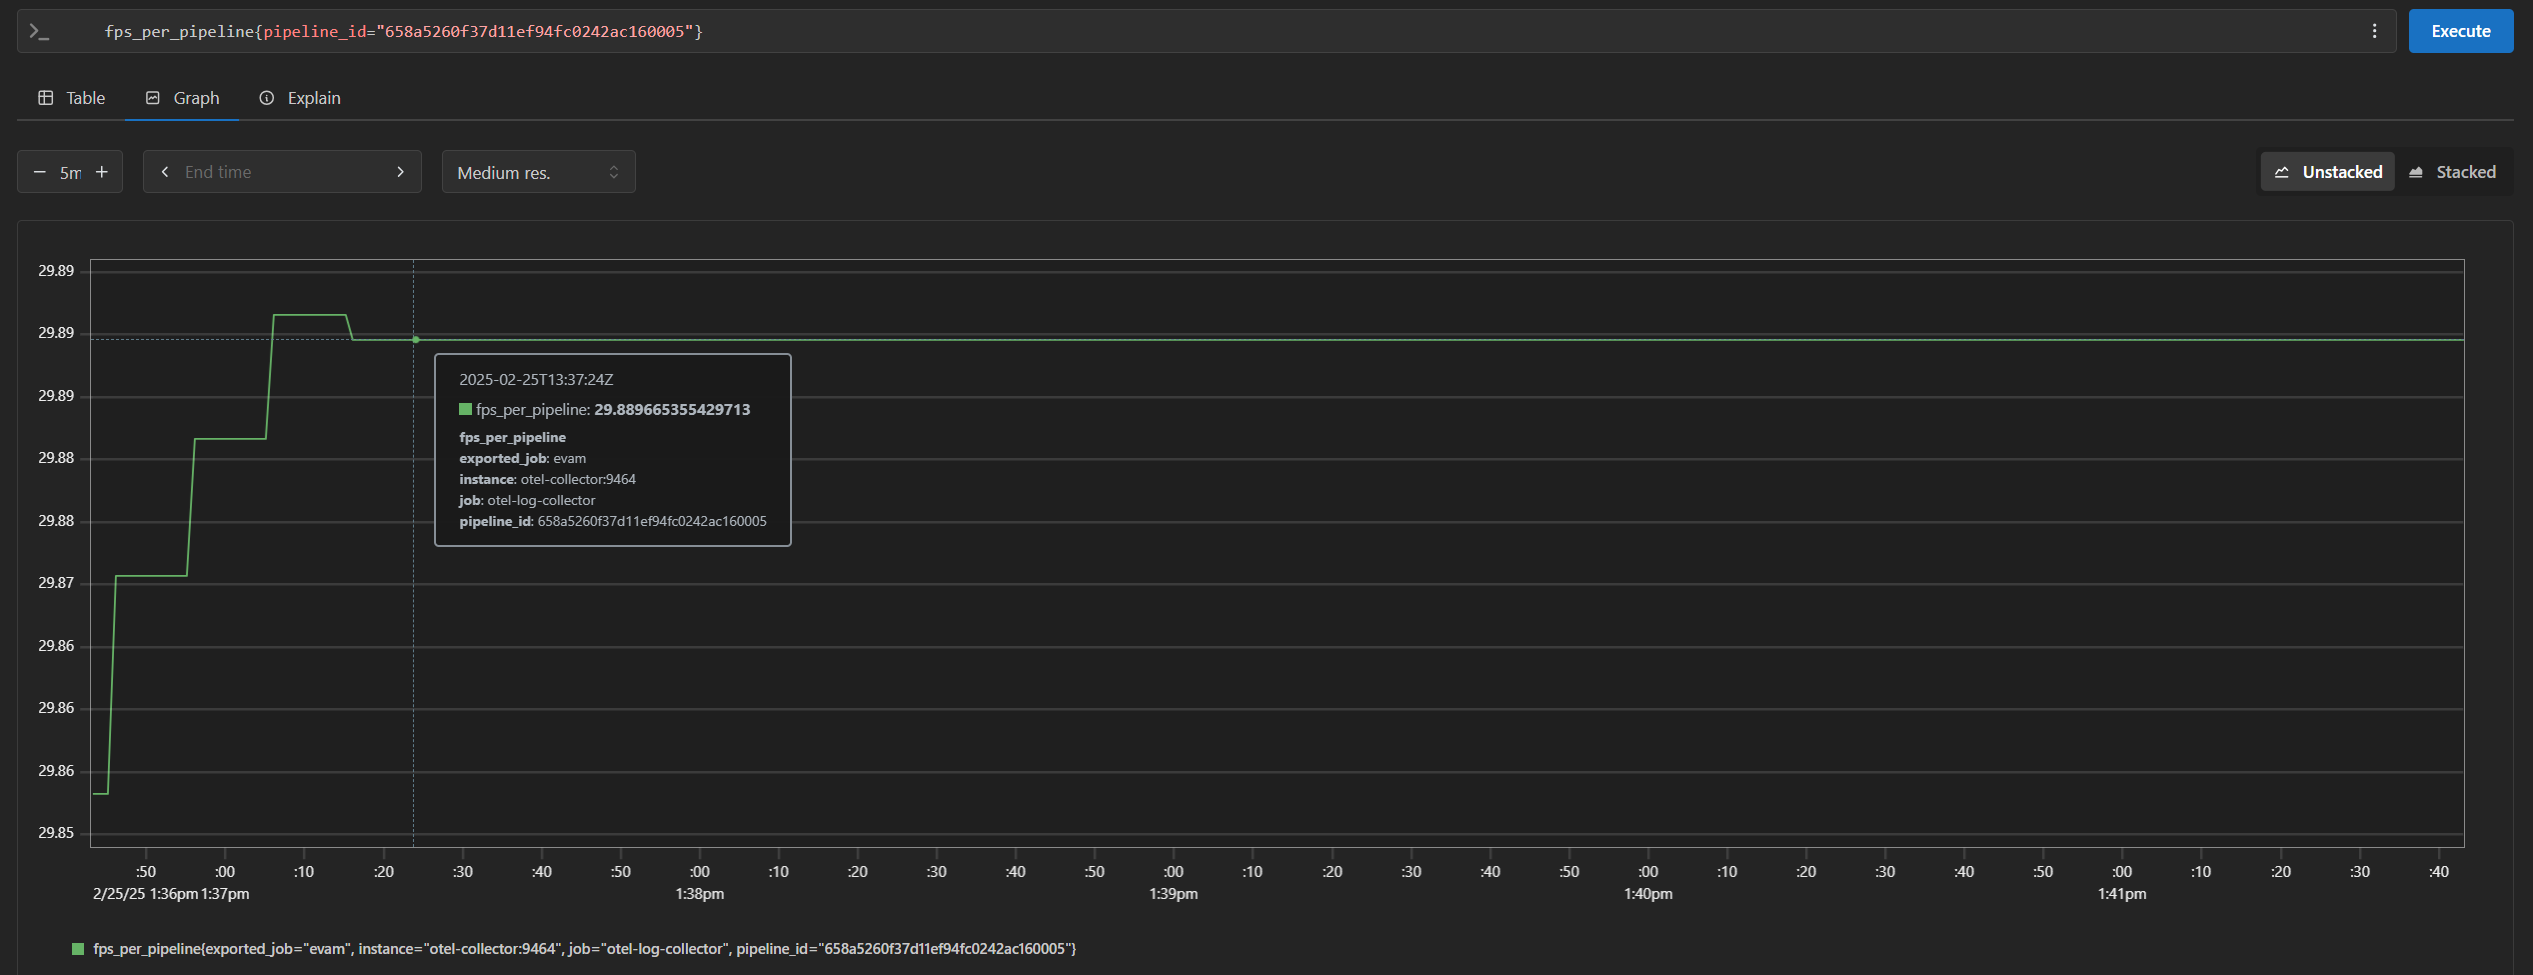
Visualizing metrics & logs in Grafana#
Open Grafana by visiting http://<HOST_IP>:<GRAFANA_PORT> (login with: GRAFANA_USERNAME / GRAFANA_PASSWORD)
Add data sources in Grafana#
Add Prometheus
Click on “Add data source” and select Prometheus.
Set URL to: http://<HOST_IP>:<PROMETHEUS_PORT>
Click Save & test.
Add Loki
Click on “Add data source” and select Loki.
Set URL to: http://<HOST_IP>:3100
Click Save & test.
View metrics from Prometheus#
Go to “Explore” and choose Prometheus as data source.
Enter queries like:
cpu_usage_percentage,memory_usage_bytes,fps_per_pipeline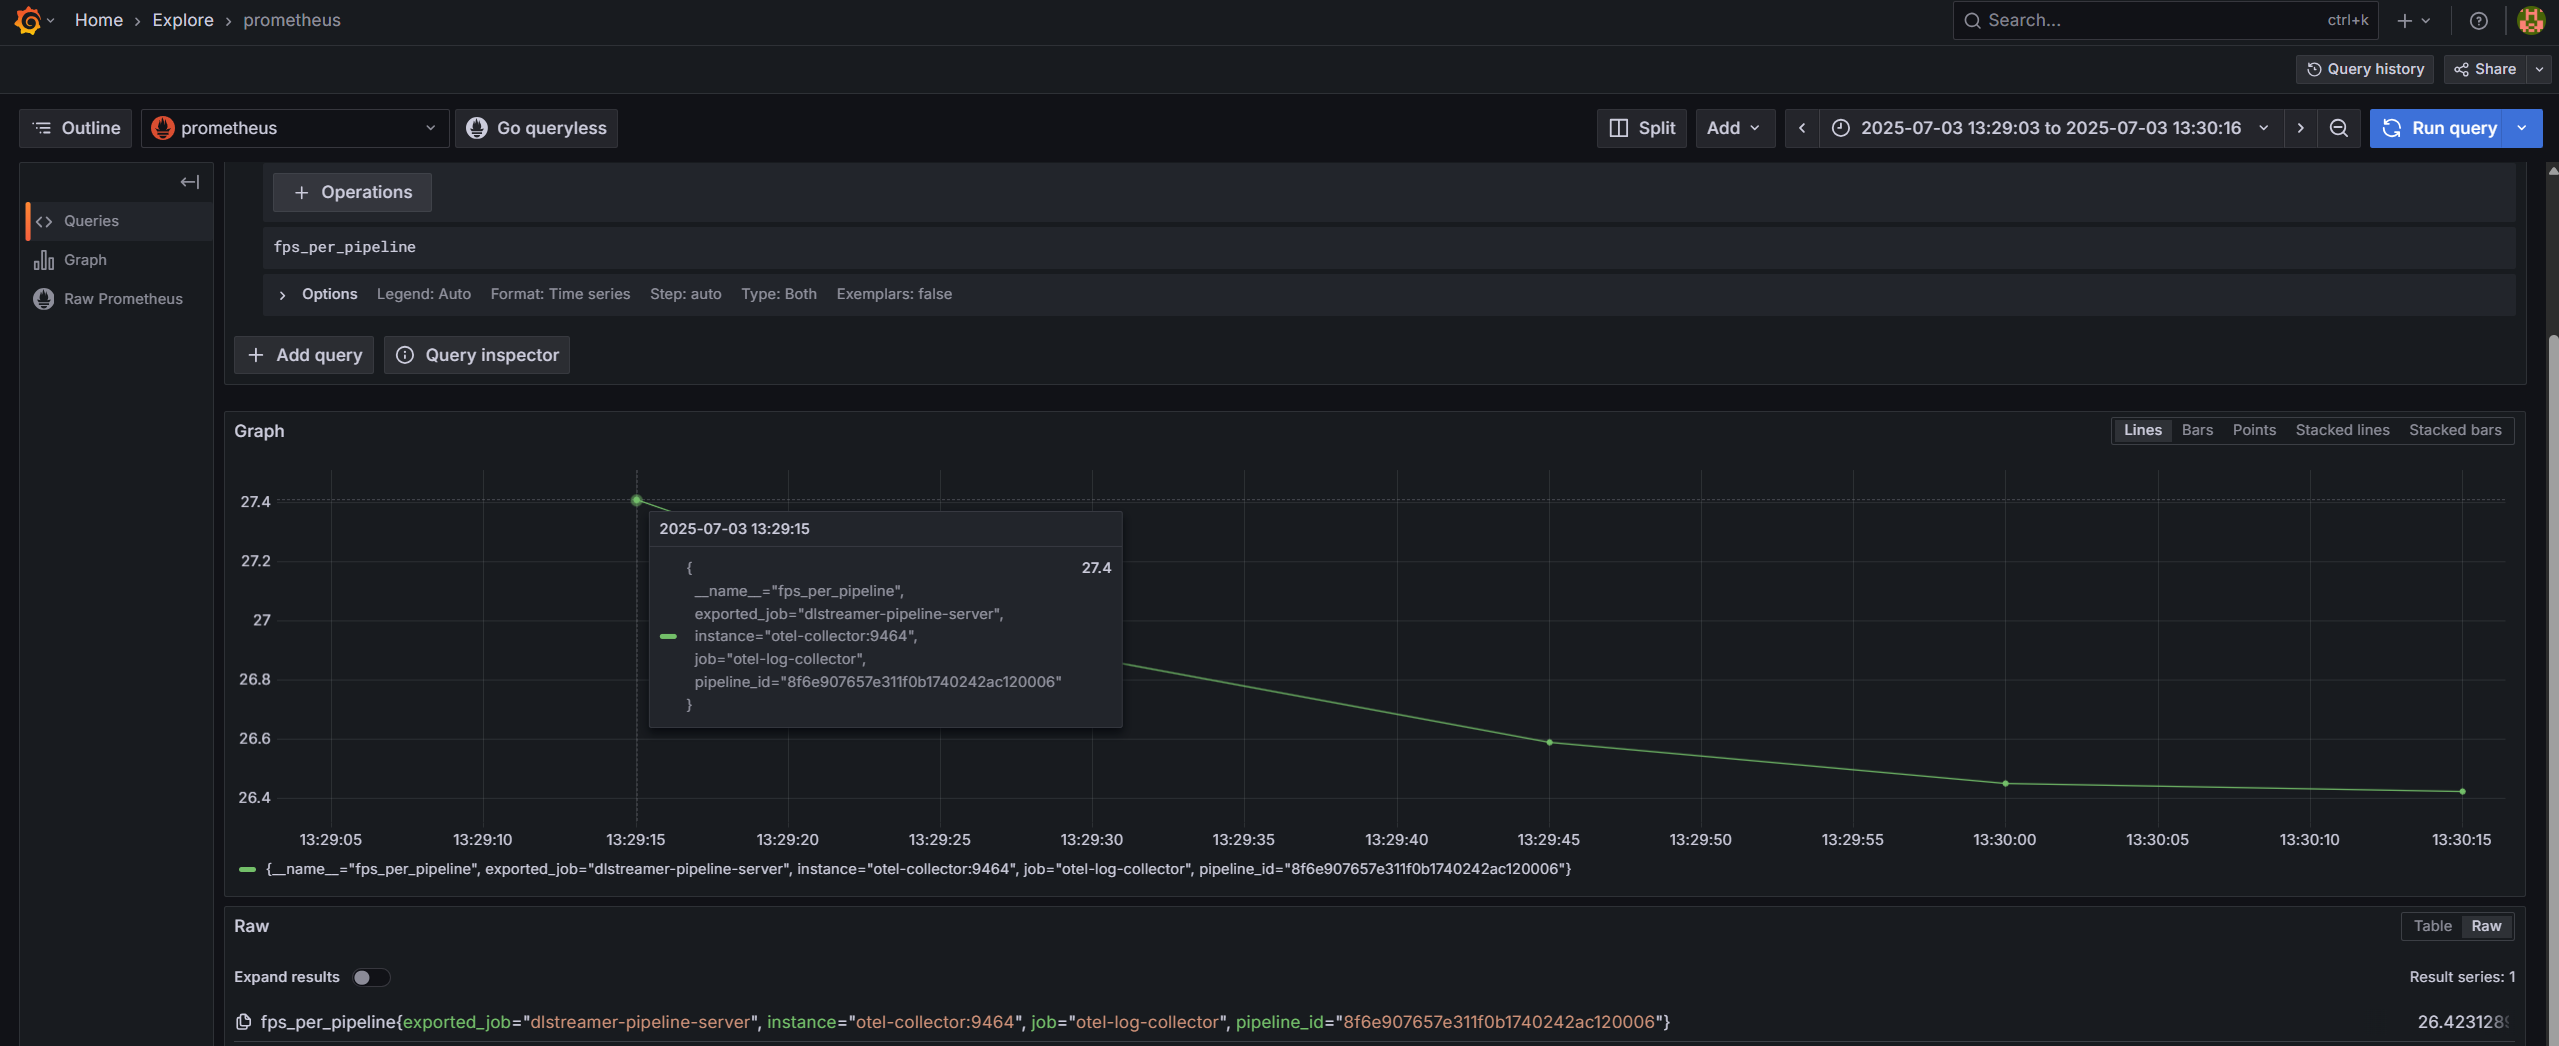
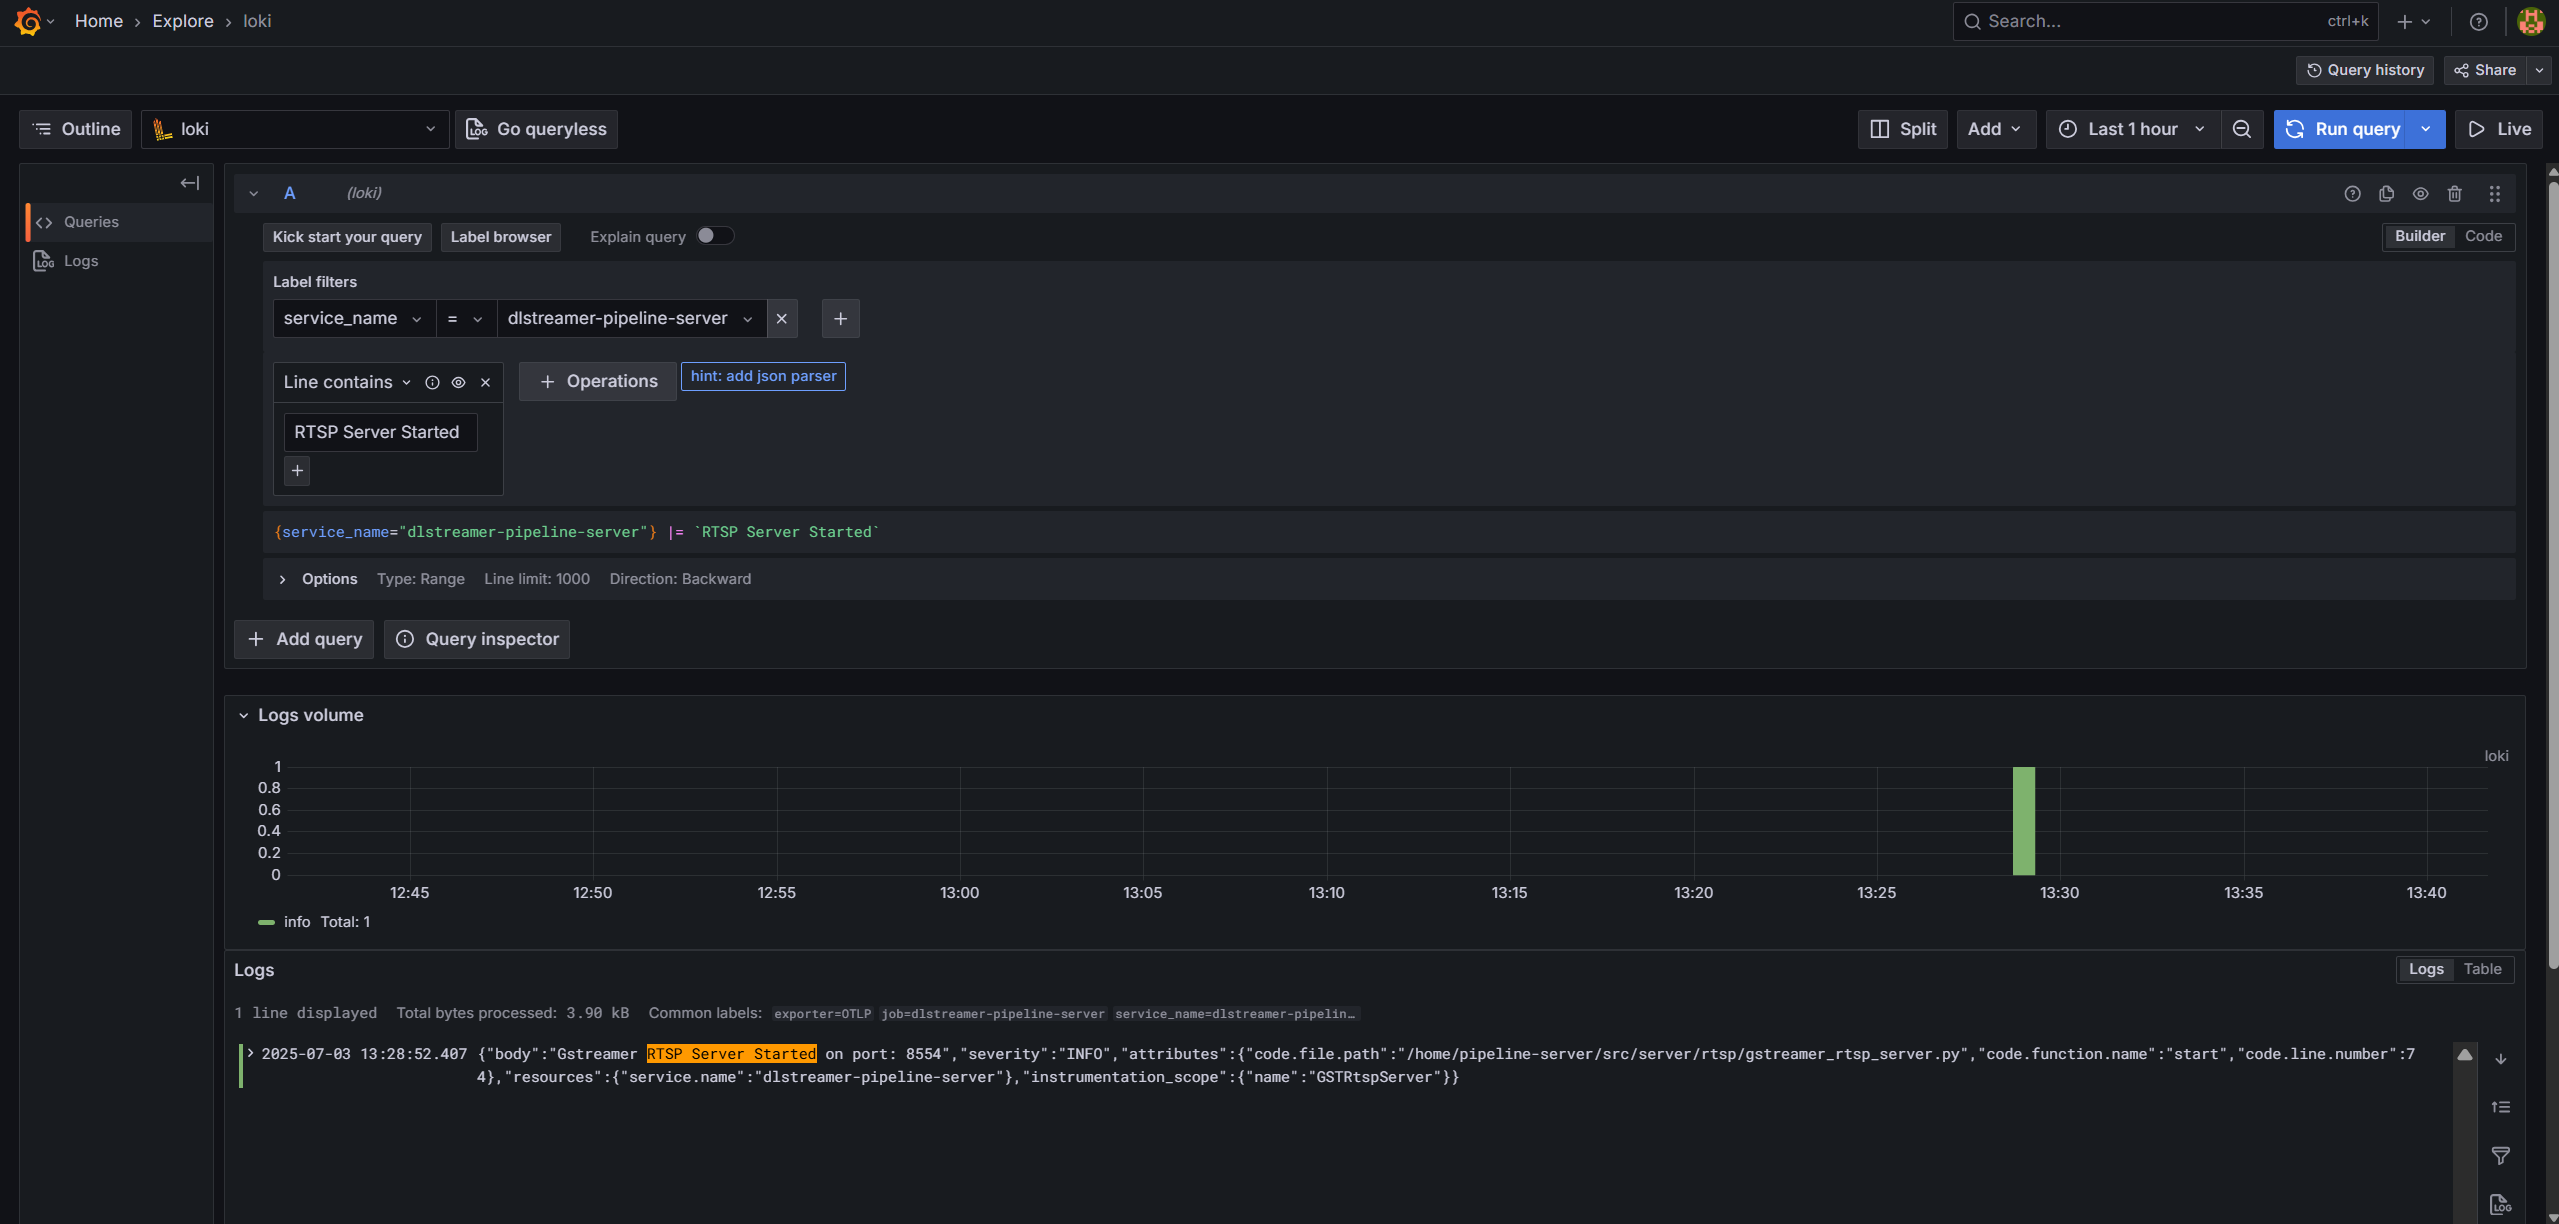
View logs from Loki#
Go to “Explore” and choose Loki as data source.
Enter query with appropriate filters and view real time logs.