Class Report Flow#
The Class Report feature generates a structured, editable teaching evaluation report from
processed class session data, including ASR transcripts, AI summaries, mind maps, topic
segmentation, attendance, speaking speed, and hand-raise counts. It also provides
AI-generated insights on classroom interaction, atmosphere, and teaching recommendations.
The report can be exported as a Word (.docx) or PDF document.
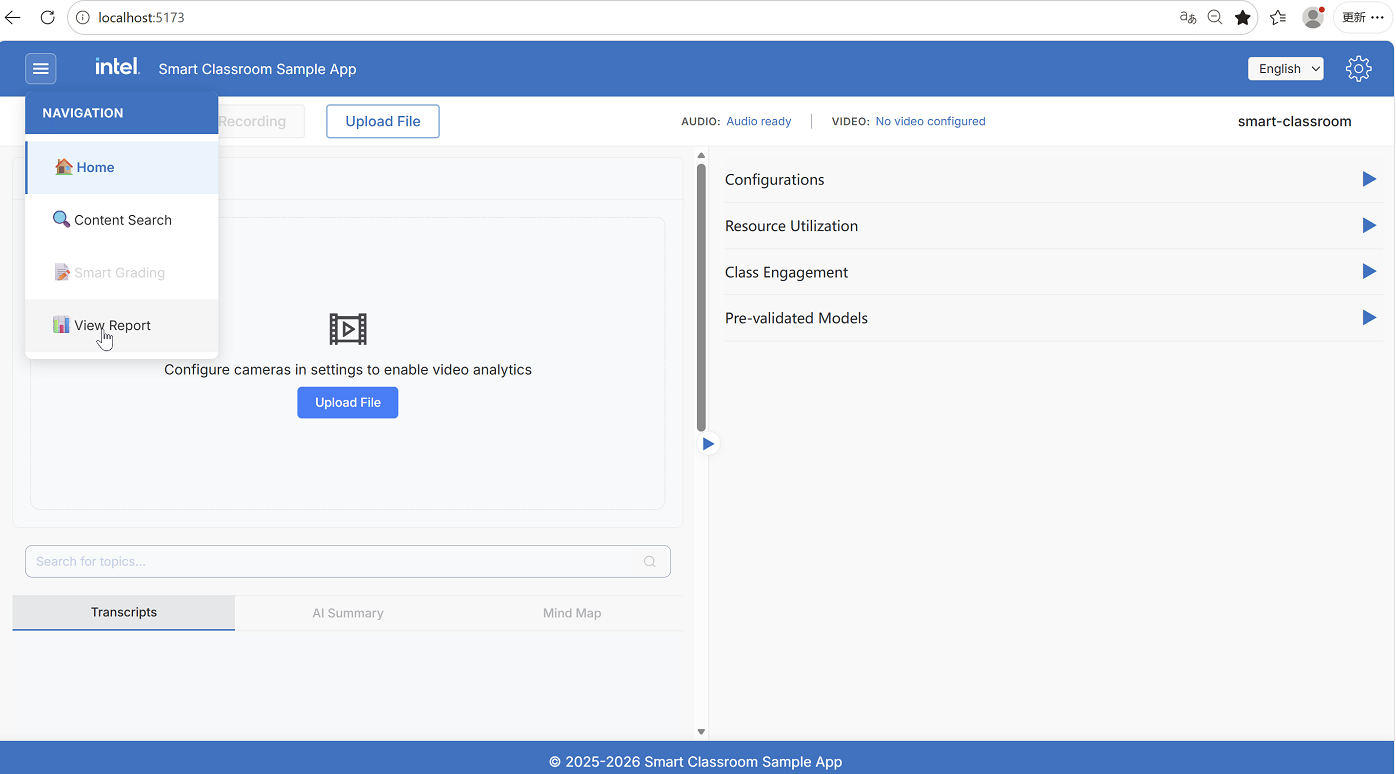
To open the Class Report, click View Report in the top navigation menu on the Smart Classroom main screen:
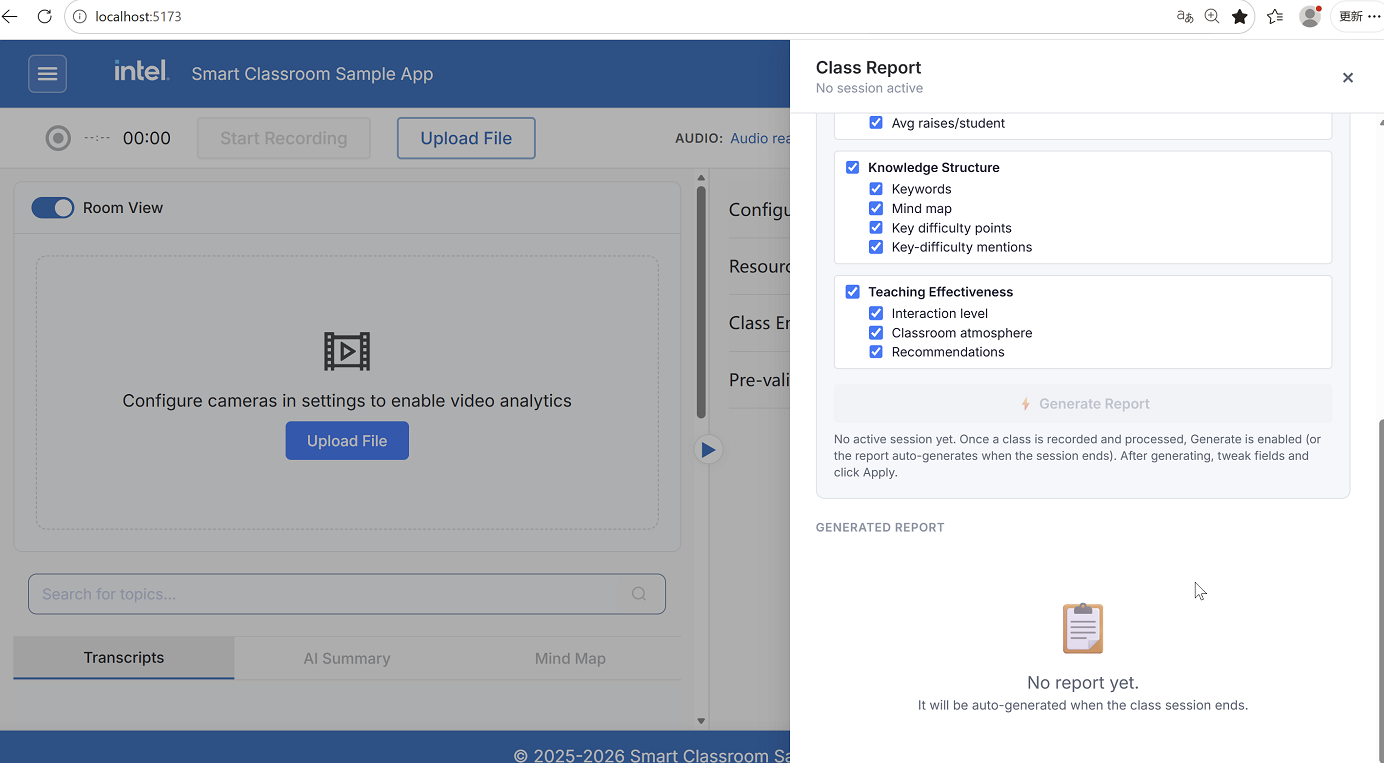
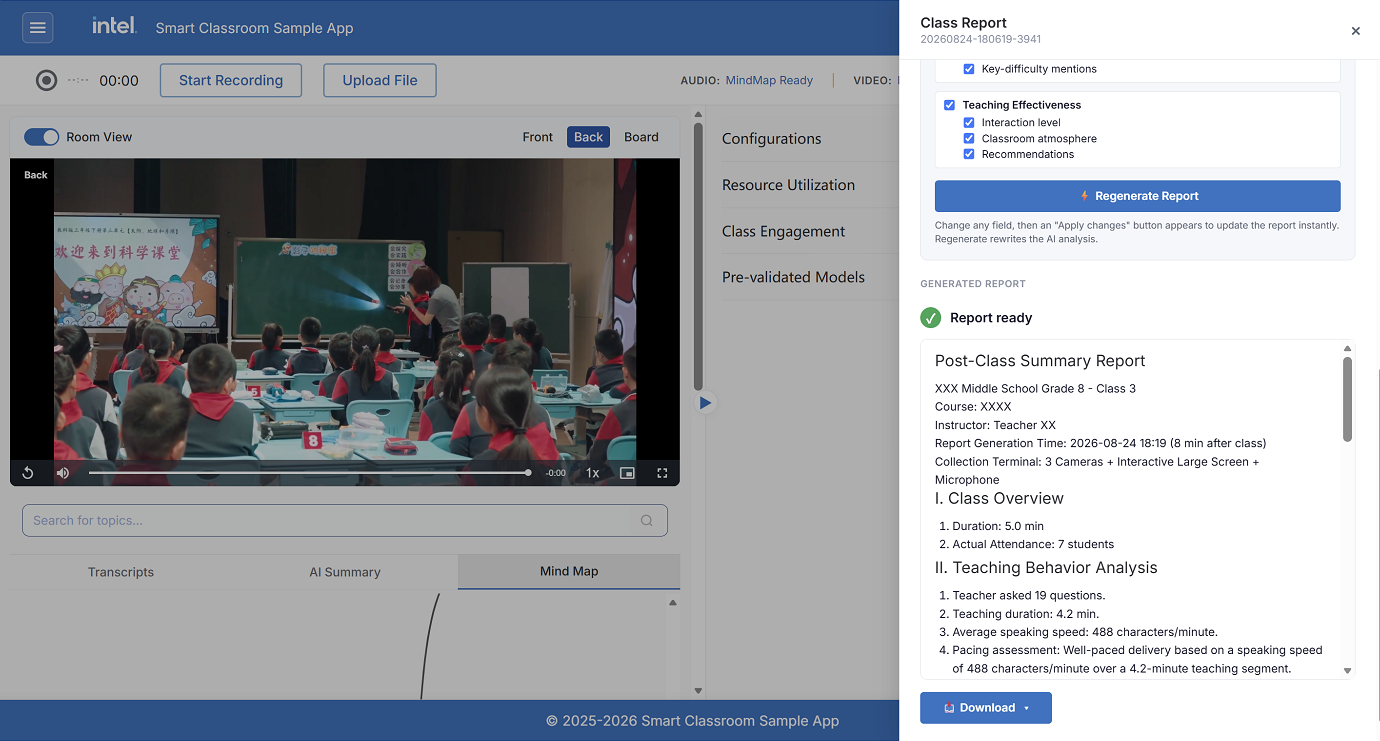
The Class Report opens as a slide-in panel with two areas:
Report Fields - Choose which sections and data points to include, and type in the basic class information.
Generated Report - A live preview of the report, with Download options once it is ready.
When Can a Report Be Generated?#
The report reads content segmentation as one of its data sources, so Generate becomes available only after processing has settled:
Audio / Audio+Video - After transcription, summary, mind map, and content segmentation complete.
Video-only - After video processing reaches playback mode.
If a session is still processing, the Generate Report button stays disabled and the panel shows a hint explaining what to wait for.
Step 1: Select Report Fields#
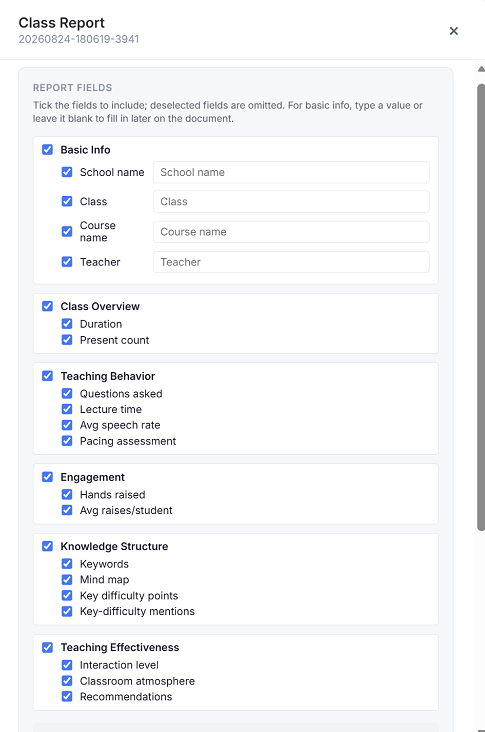
The Report Fields section lists every data point the report can contain, organized into groups. Tick the fields to include; deselected fields are omitted from the document.
Group |
Example fields |
Source |
|---|---|---|
Basic Info |
School, class, course, and teacher name |
Typed in manually |
Class Overview |
Duration, attendance |
Measured data |
Teaching Behavior |
Question count, teaching duration, speaking speed, pacing assessment |
Measured data |
Engagement |
Hand-raise count and average |
Measured data |
Knowledge Structure |
Keywords, mind map, key/difficult points |
Extracted from the summary |
Teaching Effectiveness |
Interaction level, classroom atmosphere, recommendations |
AI-generated |
Tick a group header to toggle all of its fields at once.
Basic Info#
Basic info cannot be derived from audio or video, so the teacher types it in. For each basic info field:
Tick the checkbox to include the field.
Type a value, or leave it blank to fill it in later on the printed document.
Some metadata (such as the report generation time) is added automatically and is not shown as a toggleable field.
Note
Fields are split into two kinds. Raw fields (numbers, names, keywords, mind map) are filled directly from measured data and are never invented by the AI. Only the Teaching Effectiveness fields are written by the language model, using the class summary, mind map, and segmentation as context.
Step 2: Generate the Report#
Click ⚡ Generate Report. The report is assembled in two passes:
The template is filled with the raw, measured fields immediately (shown as a skeleton).
The AI writes the Teaching Effectiveness analysis, which streams into the preview as it is produced.
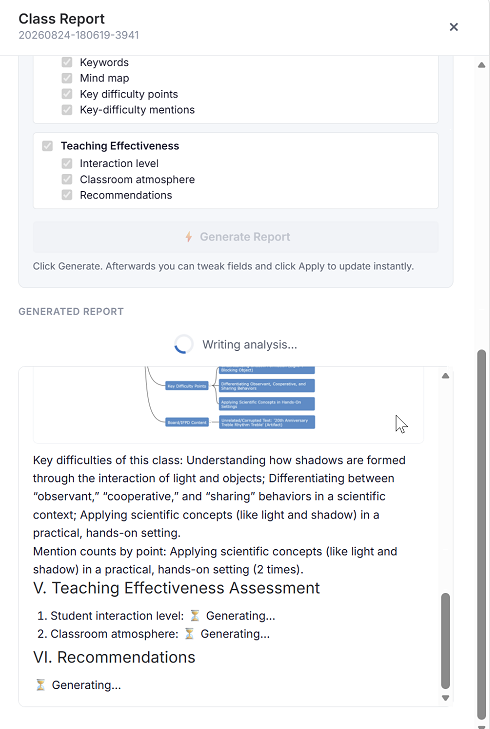
When finished, the panel shows ✓ Report ready with the full report rendered in the preview.
Step 3: Adjust Fields#
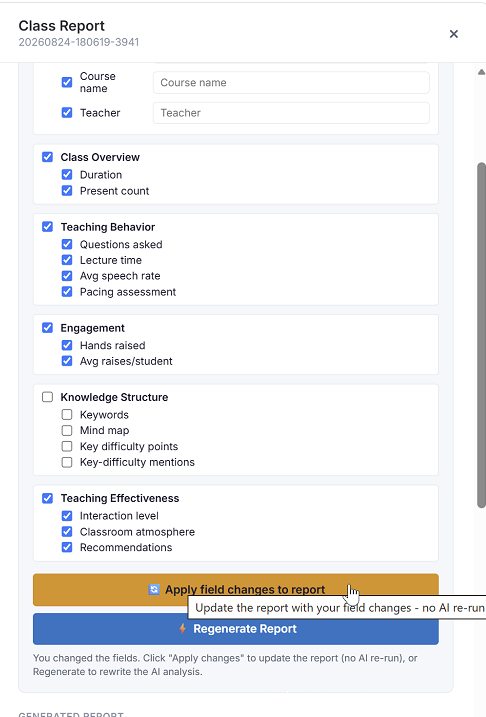
After a report exists, you can change the selected fields or edit the basic info without re-running the AI:
🔄 Apply field changes - Re-projects the report onto your current selection and manual values instantly. No AI re-run. This button appears after you change any field.
⚡ Regenerate Report - Rewrites the AI analysis from scratch.
Step 4: Download#
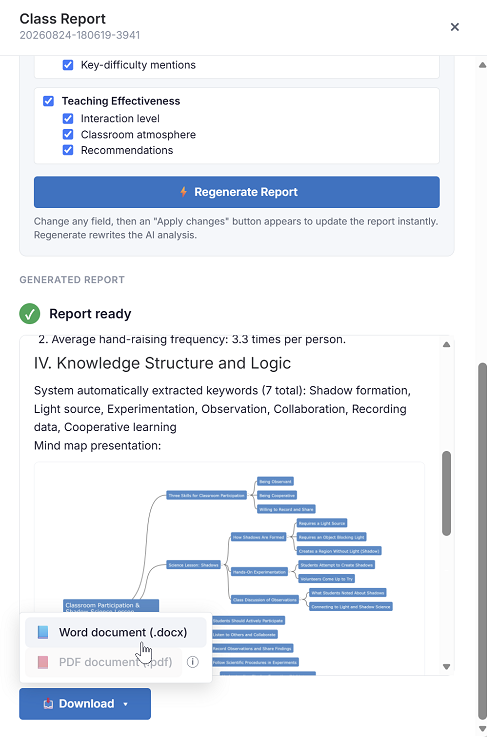
Open the 📥 Download menu and choose a format:
Word document (
.docx) - Always available.PDF document (
.pdf) - Available when LibreOffice is installed on the server. When it is missing, the item is disabled with an install hint (sofficemust be on thePATH).
Learn More#
Application Flow: End-to-end application flow.
How It Works: Technical architecture and design details.