Visual Pipeline and Platform Evaluation Tool#
Assess Intel® hardware options, benchmark performance, and analyze key metrics to optimize hardware selection for AI workloads.
Overview#
The Visual Pipeline and Platform Evaluation Tool simplifies hardware selection for AI workloads by allowing you to configure workload parameters, benchmark performance, and analyze key metrics such as throughput, CPU, and GPU usage. With its intuitive interface, the tool provides actionable insights to help you optimize hardware selection and performance.
Use Cases#
Evaluating Hardware for AI Workloads: Assess Intel® hardware options to balance cost, performance, and efficiency. Benchmark AI workloads under real-world conditions by adjusting pipeline parameters and comparing performance metrics.
Performance Benchmarking for AI Models: Ensure your models meet performance goals and KPIs. Test AI inference pipelines with different accelerators to measure throughput, latency, and resource utilization.
Key Features#
Optimized for Intel® AI Edge Systems: Run the pipeline directly on target devices for seamless Intel® hardware integration.
Comprehensive Hardware Evaluation: Access metrics like CPU frequency, GPU power usage, memory utilization, and system temperature.
Configurable AI Pipelines: Adjust parameters like input channels, object detection models, and inference engines for tailored performance tests.
Automated Video Generation: Generate synthetic test videos to evaluate system performance under controlled conditions.
How It Works#
The Visual Pipeline and Platform Evaluation Tool integrates with AI-based video processing pipelines to help you evaluate hardware performance.
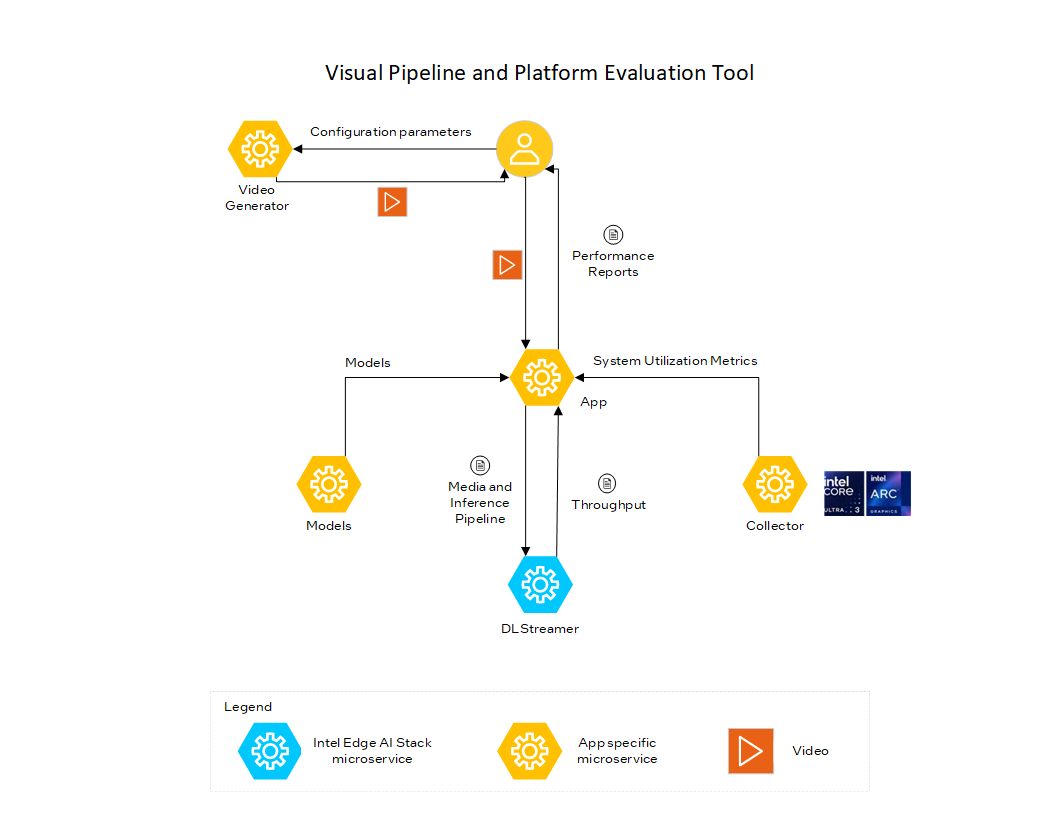
Workflow Overview#
Data Ingestion: Provide video streams from live cameras or recorded files. Configure pipeline parameters to match your evaluation needs.
AI Processing: Apply AI inference using OpenVINO™ models to detect objects in video streams.
Performance Evaluation: Collect hardware performance metrics, including CPU/GPU usage, power consumption, and thermal data.
Visualization & Analysis: View real-time performance metrics on the dashboard to compare configurations and optimize settings.