Deploy Time Series Analytics Microservice#
This guide describes how to build, start, and stop the Time Series Analytics Microservice (TSAM) as part of the ViPPET stack, and how to configure it with a sample Wind Turbine anomaly detection UDF.
Prerequisites#
Docker and Docker Compose installed
makeavailable on the hostwgetinstalled (required to download UDF packages)
Time Series Analytics can run on CPU or GPU, but NPU is not supported.
Activate the Experimental Time Series stack#
The Time Series Analytics Microservice is started from the experimental compose stack. Use the project Makefile targets from the tool root directory:
cd tools/visual-pipeline-and-platform-evaluation-tool
Activation is performed with the
build-experimental and run-experimental targets.
Build the experimental stack#
Build all required Docker images:
make build-experimental
Start the experimental stack#
Start all services, including the Time Series Analytics Microservice:
make run-experimental
This command enables the Time Series flow by layering compose.experimental.yml on top of the standard
compose stack, including ia-time-series-analytics-microservice and ia-timeseries-ingestion.
Verify that Time Series services are active#
Check if both Time Series services are running:
docker ps --format '{{.Names}}' | grep -E 'ia-time-series-analytics-microservice|ia-timeseries-ingestion'
Stop and Clean#
Stop all running services and clean any artifacts:
make stop-experimental
make clean-experimental
Deploy the Wind Turbine anomaly detection UDF#
Once the services are running, follow the steps below to deploy the Wind Turbine anomaly detection UDF into the TSAM.
The TSAM Swagger UI is available at http://localhost:5000/docs.
Step 1. Download the UDF package#
Download the pre-built Wind Turbine UDF tar archive:
wget https://raw.githubusercontent.com/open-edge-platform/edge-ai-resources/main/timeseries-udf-deployment-packages/wind-turbine-anomaly-detection.tar
Step 2. Upload the UDF package#
Open http://localhost:5000/docs in a browser.
Navigate to POST /udfs/package.
Click Try it out.
Under Choose File, select the downloaded
wind-turbine-anomaly-detection.tarfile.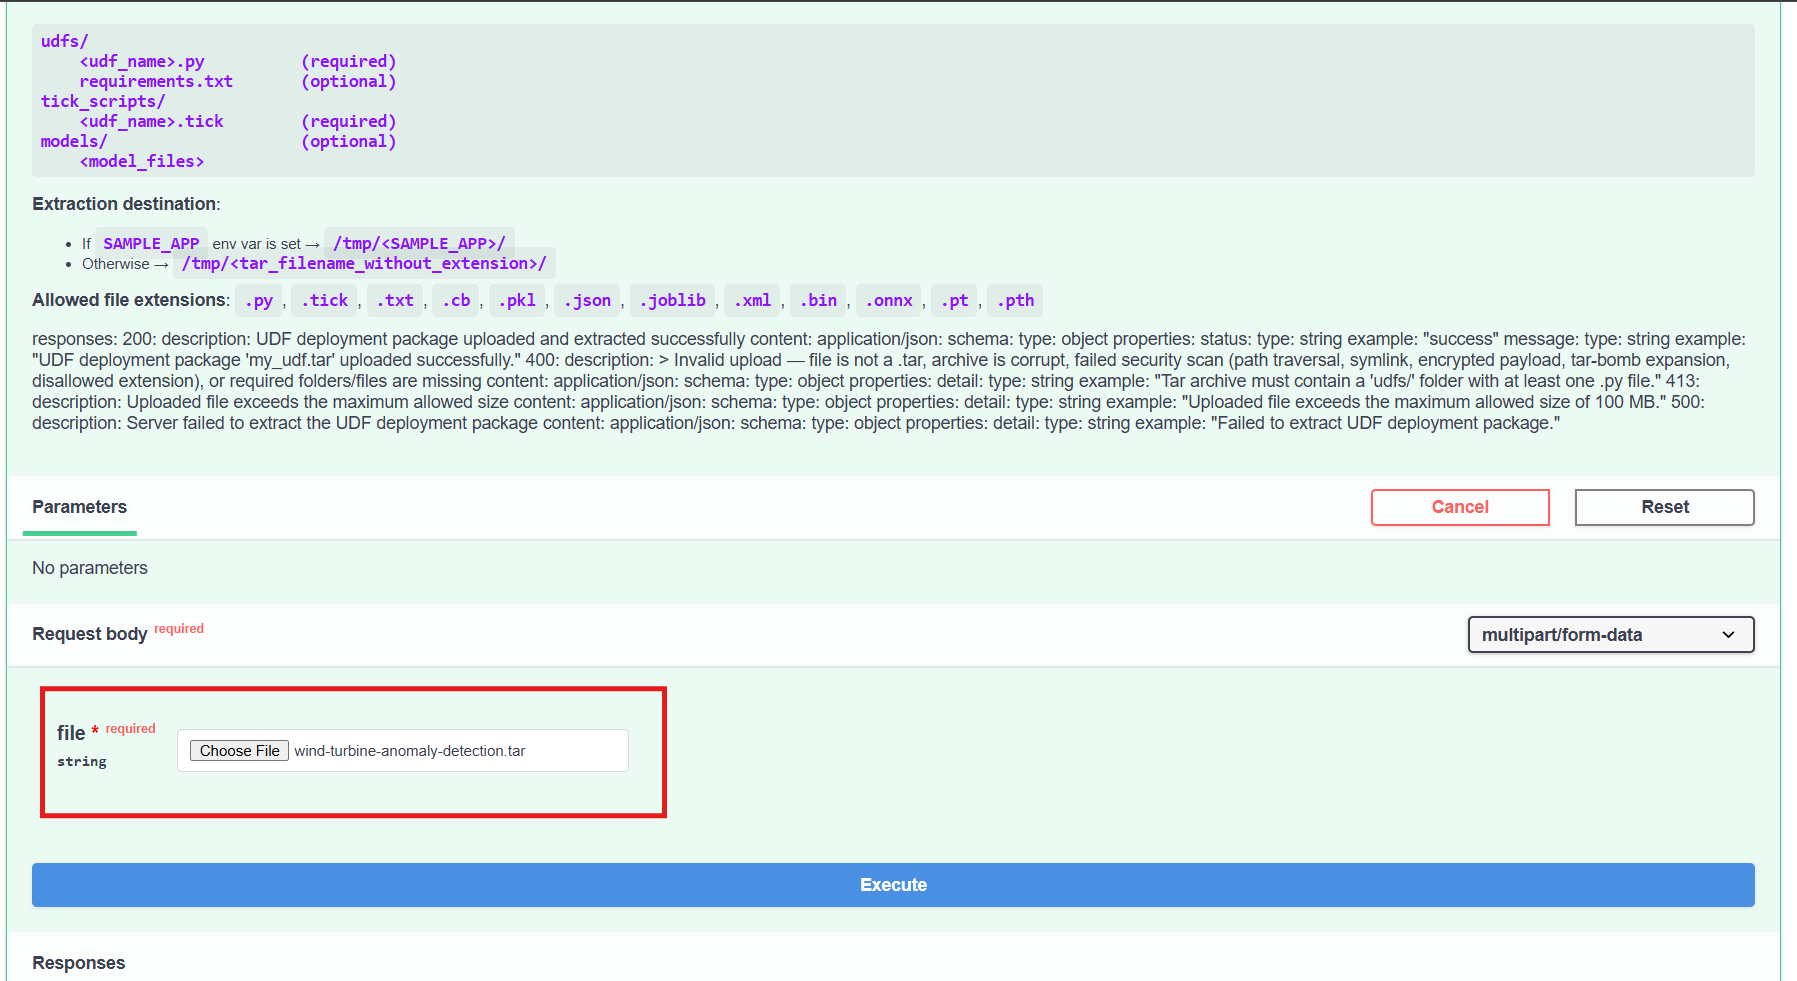
Click Execute.
A successful response returns the message: UDF deployment package 'wind-turbine-anomaly-detection.tar' uploaded successfully.
Step 3. Apply the configuration#
Open http://localhost:5000/docs in a browser.
Navigate to POST /config.
Click Try it out.
In the Request Body field, paste the following configuration:
{
    "udfs": {
        "name": "windturbine_anomaly_detector",
        "models": "windturbine_anomaly_detector.pkl",
        "device": "cpu"
    }
}
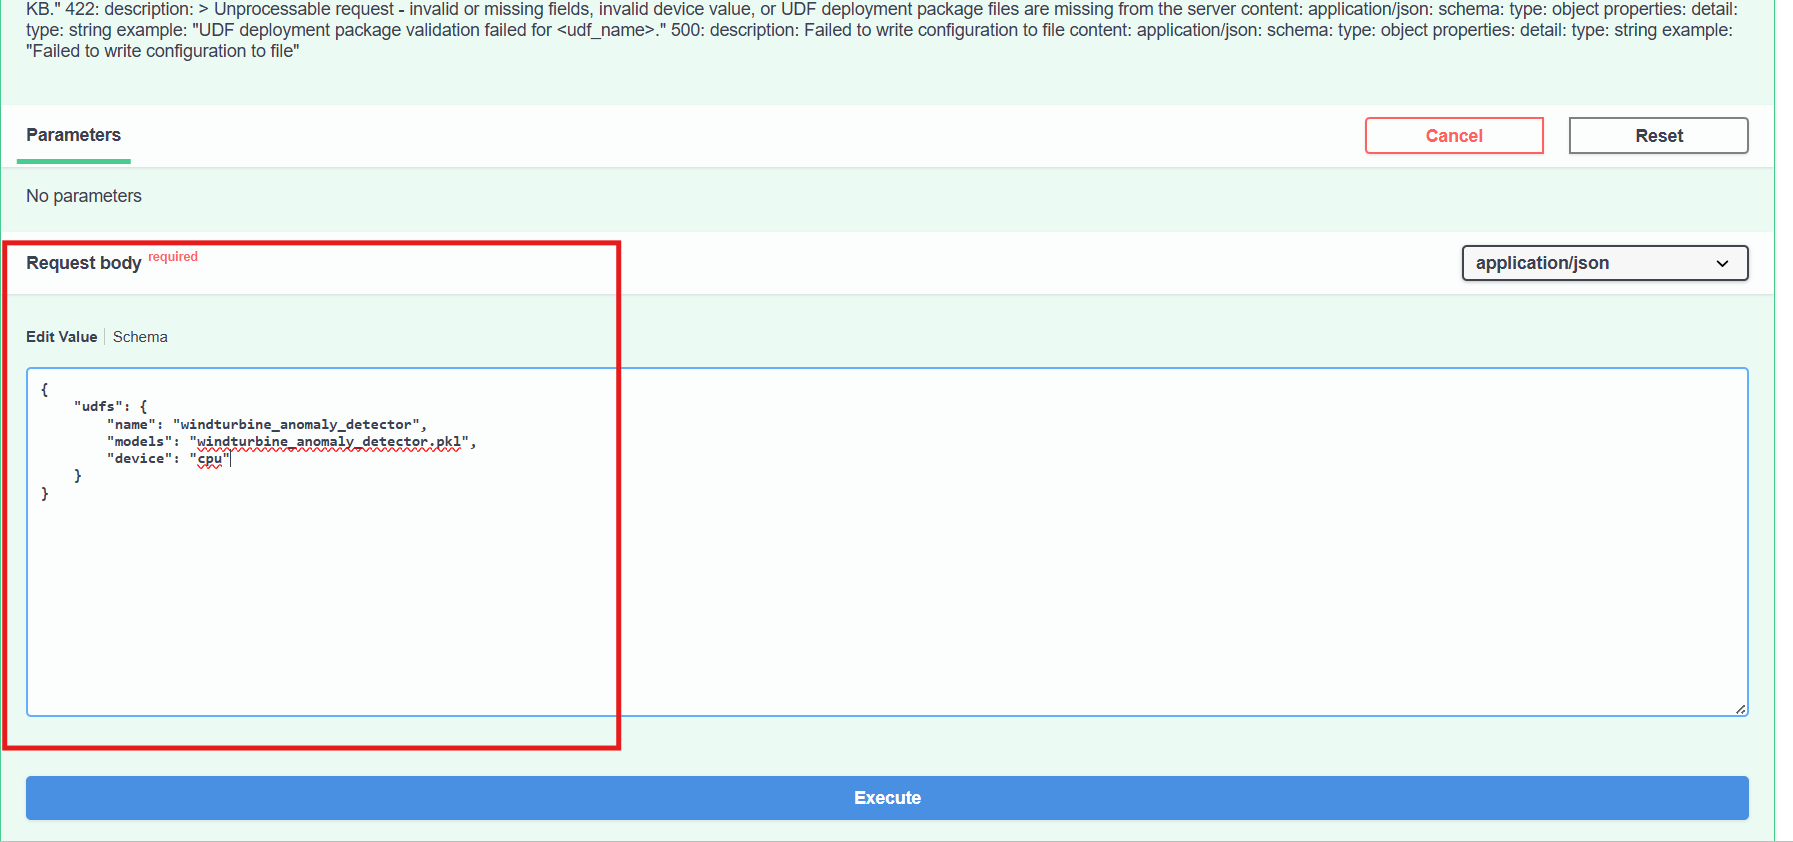
Click Execute.
A successful response returns the message: Configuration updated successfully.
Step 4. Verify Time Series logs#
Check that processing is running correctly:
docker logs -f ia-time-series-analytics-microservice
In a separate terminal, you can also verify ingestion activity:
docker logs -f ia-timeseries-ingestion
You should see output similar to the following:
2026-05-26 04:43:45,599 - classifier_startup - INFO - Connected to Kapacitor on port 9092
2026-05-26 04:43:45,621 - classifier_startup - INFO - Kapacitor initialized successfully
2026-05-26 04:43:46,201 - classifier_startup - INFO - HTTP service listening on [::]:9092
2026-05-26 04:43:46,201 - classifier_startup - INFO - Started task windturbine_anomaly_detector
INFO: 172.18.0.7:52784 - "POST /input HTTP/1.1" 200 OK
INFO: 172.18.0.7:52786 - "POST /input HTTP/1.1" 200 OK
Step 5. Verify the pipeline in the ViPPET UI#
After TSAM services and UDF configuration are ready, verify the full flow in the UI.
5.1 Confirm the new pipeline appears on Dashboard#
Open ViPPET in the browser and go to Dashboard. In the Pipelines section, you should see the new Wind Turbine Anomaly Detection pipeline card.

5.2 Open the Wind Turbine pipeline in Pipeline Editor#
Click the Wind Turbine Anomaly Detection card to open Pipeline Editor. You should see the flow:
Input
Anomaly Detection
Output

5.3 Run pipeline and inspect runtime data#
Click Run pipeline in the top-right corner.
In the right panel:
In the Performance tab, verify charts are updating for, among others:
Inference Time
End-to-End Time
In the Metadata JSON tab, verify ingestion payload includes values such as:
grid_active_powerwind_speed

