Computer Vision Pipeline Benchmarking#
The provided Python-based script works with Docker Compose to get pipeline performance metrics like video processing in frames-per-second (FPS), memory usage, power consumption, and so on.
Prerequisites#
Docker
Docker Compose
Make
Git
Code from Retail Use Cases Repo and its submodule Performance Tools Repo
Note: To install the submodule, run
make update-submodulesfrom the root of the retail-use-cases repo.Python environment v3.12.2
Note: This can be accomplished using Miniconda and creating a Python 3.12.2 env
sudo apt install git gcc python3-venv python3-dev
Benchmark a CV Pipeline#
Build the benchmark container and change into the benchmark-scripts directory.
    cd performance-tools/
    make build-benchmark-docker
Python packages listed in performance-tools/benchmark-scripts/requirements.txt
    cd performance-tools/benchmark-scripts/
    python3 -m venv venv
    source venv/bin/activate
    pip install -r requirements.txt
[Optional] If NPU data collection is desired, ensure that the following is correct.
a. Run the following command to get the correct path to the NPU under
/sys/deviceslspci | grep -i npu
b. Ensure the environment variable
NPU_PATHinperformance-tools/docker/docker-compose.yamlfor thenpu-utilservice or the global variable inperformance-tools/docker/npu-util/npu_logger.pyis set to the correct location.NPU_PATH="/sys/devices/pci0000:00/0000:<insert_results>/npu_busy_time_us"
Example:
If the lspci command is:
$ lspci | grep -i npu
00:0b.0 Processing accelerators: Intel Corporation Lunar Lake NPU (rev 04)
then the NPU_PATH is:
NPU_PATH="/sys/devices/pci0000:00/0000:00:0b.0/npu_busy_time_us"
Choose a CV pipeline from the Retail Use Cases Repo, Automated Self-Checkout or Loss Prevention and note the file paths to the docker compose files.
Run the benchmarking script using the docker compose file(s) as inputs to the script (sample command shown below).
Automated Self-Checkout:
python benchmark.py --compose_file ../../src/docker-compose.yml --pipeline 1
Retail Use Cases:
python benchmark.py --compose_file ../../use-cases/gst_capi/add_camera-simulator.yml --compose_file ../../use-cases/gst_capi/add_gst_capi_yolov5_ensemble.yml
Go to Arguments to understand how to customize the benchmarks
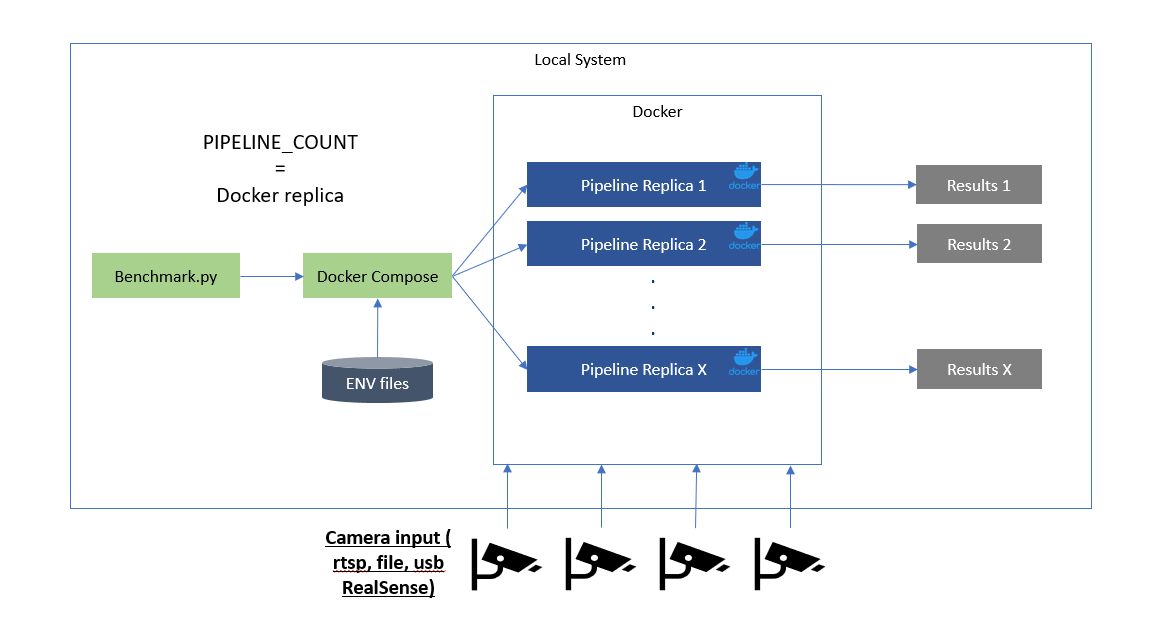
Specific number of pipelines with single container
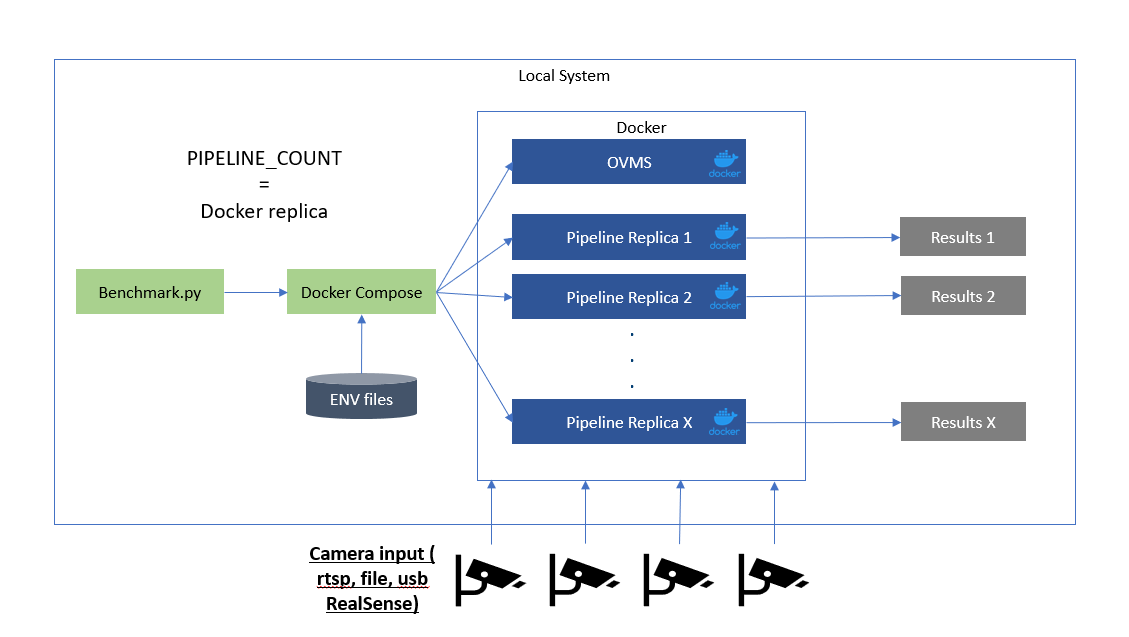
Specific number of pipelines with OVMS and Client
Benchmark Stream Density for CV Pipelines#
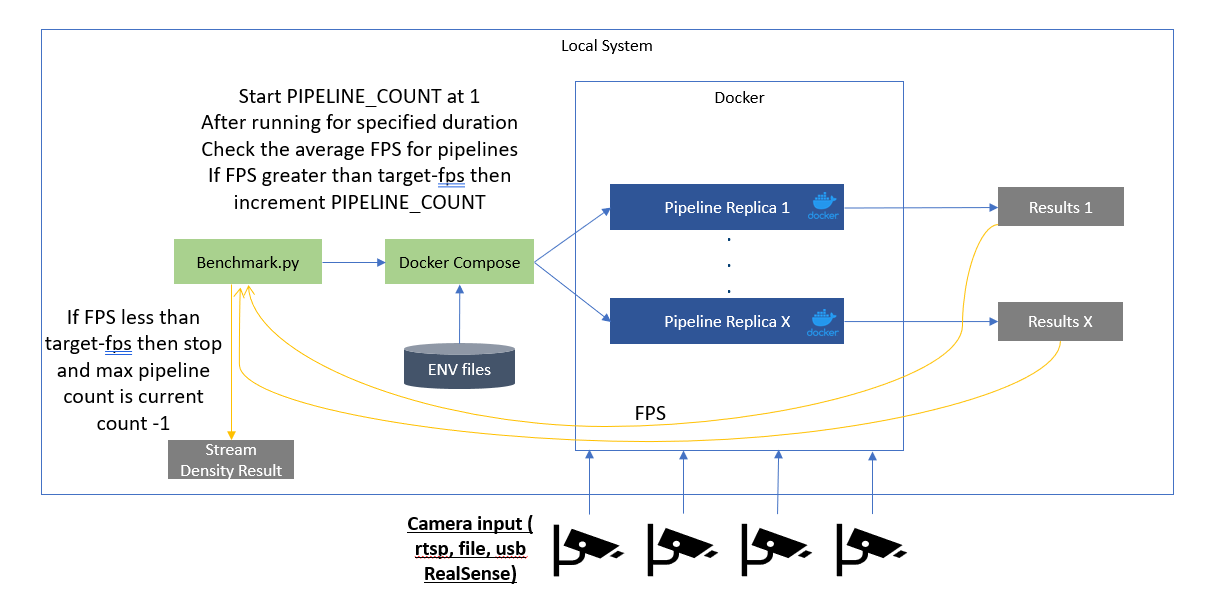
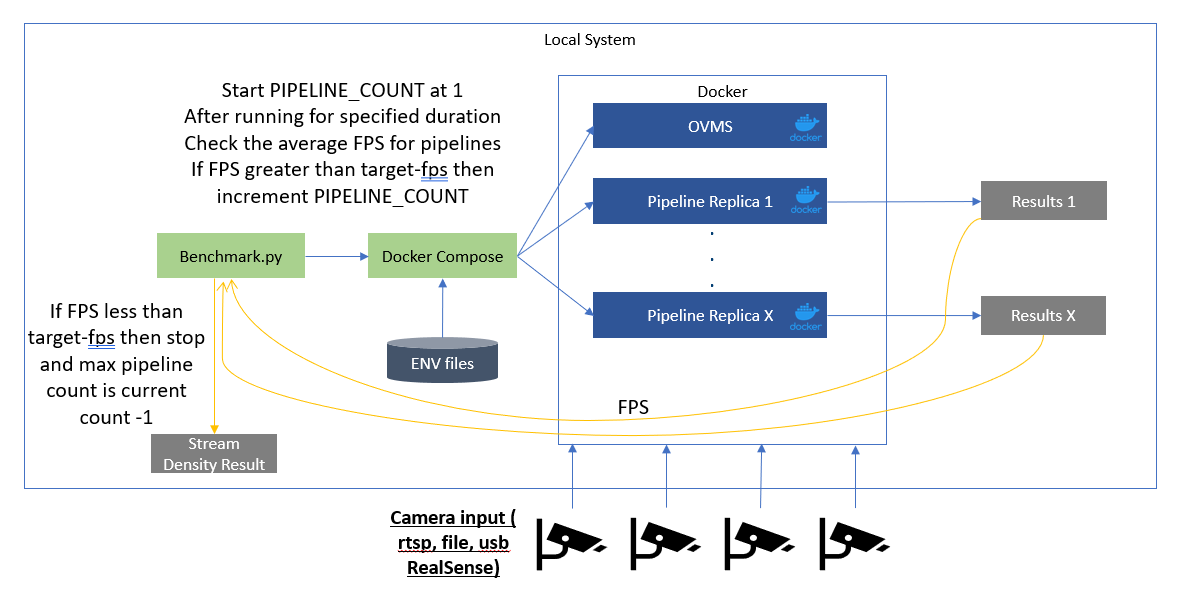
Benchmarking a pipeline can also discover the maximum number of workloads or streams that can be run in parallel for a given target FPS. You can use this to determine the hardware required to achieve the desired performance for CV pipelines.
To run the stream density functionality use --target_fps and/or --density_increment as inputs to the benchmark.py script:
python benchmark.py --retail_use_case_root ../../retail-use-cases --target_fps 14.95 --density_increment 1 --init_duration 40 --compose_file ../../retail-use-cases/use-cases/grpc_python/docker-compose_grpc_python.yml
where the parameters:
target_fpsis the given target frames per second (fps) to achieve for maximum number of pipelinesdensity_incrementis to configure the benchmark logic to increase the number of pipelines each time while trying to find out the maximum number of pipelines before reaching the given target fps.init_durationis the initial duration period in seconds before pipeline performance metrics are takenNote: It is recommended to set
--target_fpsto a value lesser than your target FPS to account for real world variances in hardware readings.
Stream density with single container
Stream density with OVMS and Client
Consolidate results#
The consolidate_multiple_run_of_metrics.py script processes and consolidates performance metrics from various log files (JSON, CSV, and text-based logs) into a structured report. It extracts key performance indicators (KPIs) such as CPU & GPU utilization, memory bandwidth, disk I/O, power consumption, and FPS from multiple sources; aggregates the data; and outputs a summary file.
On performance-tools/benchmark-scripts:
make consolidate
The summary.csv content should look like this:
    Camera_20250303214521714278352 FPS,14.86265306122449
    Camera_20250303214521714278352 Last log update,03/03/2025 14:46:263943
    CPU Utilization %,10.069166666666668
    Memory Utilization %,19.70717535119376
    Disk Read MB/s,0.0
    Disk Write MB/s,0.002814426229508197
    S0 Memory Bandwidth Usage MB/s,8012.58064516129
    S0 Power Draw W,19.159666666666666
Plot Utilization Graphs#
After running a benchmark, you can generate a consolidated CPU, NPU, and GPU usage graph based on the collected logs using:
On performance-tools/benchmark-scripts:
make plot
This command generates a single PNG image (plot_metrics.png) under the results directory, showing:
CPU Usage Over Time
NPU Utilization Over Time
GPU Usage Over Time for each device found
Modifying Additional Benchmarking Variables#
Arguments#
Argument |
Type |
Default Value |
Description |
|---|---|---|---|
|
|
|
Number of pipelines |
|
|
|
Stream density target FPS; can take multiple values for multiple pipelines with 1-to-1 mapping via |
|
|
|
Container names for stream density target; used together with |
|
|
|
Pipeline increment number for stream density; dynamically adjusted if not specified |
|
|
|
Full path to the directory for logs and results |
|
|
|
Time in seconds, not needed when |
|
|
|
Initial time in seconds before starting metric data collection |
|
|
|
Desired running platform (cpu, core, xeon, dgpu.x) |
|
|
|
Path(s) to Docker Compose files; can be used multiple times |
|
|
|
Full path to the retail-use-cases repo root |
|
|
|
Docker container name to get logs from and save to a file |
|
|
|
Full path to the parsing script to obtain FPS |
|
|
|
Arguments to pass to the parser script; pass args with spaces in quotes: |
Change Power Profile#
For Ubuntu, follow the Choose a power profile documentation.
For Windows, follow the Change the power mode for your Windows PC documentation.
Change or Customize Metric Parsing#
Two arguments, --parser_script and --parser_args, control the script and arguments passed to it respectively from the benchmark script.
The
--parser_scriptcan be a python script that takes at least an input argument of-d <results_dir>. This will automatically get passed to the parsing script from the benchmarking script.Any other arguments may be passed using the
--parser_args, where arguments with spaces are specified in double quotes.
Developer Resources#
Python Testing#
To run the unit tests for the performance tools:
cd benchmark-scripts
make python-test
To run the unit tests and determine the coverage:
cd benchmark-scripts
make python-coverage